
Reflections on Jay Powell’s Jackson Hole Speech
Jay Powell’s Jackson Hole speech covered two topics: a review of current economic and inflation conditions and the stance of monetary policy, and an outline of the Fed’s new Strategic Plan and how it has been revised from its 2020 Strategic Plan. In summary, Powell’s assessment of current conditions tilted toward expressing more concern about labor market weakness than above-2% inflation, fueling expectations of Fed easing, while the Fed’s revised Strategic Plan eliminated some of the key asymmetries in its 2020 Strategic Plan that favored higher inflation and prioritized maximum employment, reverting more closely to its balanced 2012 Consensus statement.
The Fed’s economic review and policy stance. Powell’s assessment of the economy is that tariffs, immigration policies and related uncertainties have weighed on performance and slowed growth and weakened labor markets, and that inflation has remained elevated, and the impact of tariffs on consumer prices has become more visible. He stated that while inflation has remained above the Fed’s 2% target for 4 years, both survey and market-based measures of inflationary expectations have remained anchored to the Fed’s 2% long-run inflation target. He concluded that “…with policy in restrictive territory, the baseline outlook and the shifting balance of risks may warrant adjusting our policy stance”.
While carefully crafted, his statement suggests that the Fed is accepting of inflation modestly above its 2% target because it views current monetary policy as restrictive, which will weaken economic growth and eventually lower inflation, and the Fed is concerned about weakening labor markets. The Fed’s perception that monetary policy is restrictive is based on its observation that the real (inflation-adjusted) Fed funds rate target (4.25%-4.5%) is comfortably above the FOMC members’ estimate (in the Fed’s June 2025 Summary of Economic Projections) that the longer-run r* (the natural real rate of interest consistent with the economy growing along its potential path and the Fed’s 2% inflation target) is 1%. My view is r* is higher, which suggests that monetary policy is not as restrictive as the Fed perceives.
Financial markets picked up this tilt, as Treasury bond yields fell, the stock market rose and the US dollar fell.
The Fed’s revised Strategic Plan. Based on its obsession with the Effective Lower Bound, driven by its worries about too-low inflation and risks of a collapse in inflationary expectations combined with its view of a persistently low real interest rates, the Fed’s 2020 Strategic Plan introduced asymmetries into its 2012 Consensus Statement, advocating above-2% inflation for an undefined period of time as a “makeup strategy” following a period of below-2% inflation (through its “Flexible Average Inflation Targeting”; there was no make up strategy following an above-2% period of inflation), prioritizing its employment mandate (by replacing the word “deviations” with “shortfalls” from maximum employment), and effectively eschewing preemptive monetary tightening when full employment anticipated higher inflation.
The newly revised 2025 Strategic Plan reverses those asymmetries: it “removed language indicating that the ELB was a defining feature of the economic landscape”, removed the “makeup strategy” favoring higher inflation following periods of below-2% inflation, re-emphasized that “price stability is essential for a sound and stable economy and supports the well-being of all Americans”, dropped the use of “shortfalls” from maximum employment, and in a back-handed way reinstituted pre-emptive monetary tightening (“In particular, the use of ‘shortfalls’ was not intended as a commitment to permanently forswear preemption or to ignore labor market tightness”). The Fed also stated that “consistent with the removal of ‘shortfalls’, we made changes to clarify our approach in periods when our employment and inflation objectives are not complementary”.
While Powell avoided directly criticizing the 2020 Strategic Plan, the Fed’s explicit reversal of the asymmetries that the 2020 Plan had introduced was clear. Powell stated “In approaching this year’s review, a key objective has been to make sure that our framework is suitable across a broad range of economic conditions.” Of course, that’s a key characteristic of a robust strategy. In reality, the 2002 Strategic Plan was more of a tactical plan that allowed the Fed to overheat the economy and allow higher inflation because of its overstated fears of too-low inflation and the ELB. Powell concluded his remarks by emphasizing that the newly revised Strategic Plan is consistent with the Congressional mandate of price stability and maximum employment.
A note in remembrance of Charlie Plosser. When Charlie was President of the Federal Reserve Bank of Philadelphia, with the urging and 100% support of Fed Chair Ben Bernanke, Charlie was a key architect of the Fed’s original Strategic Plan in 2012 that established its dual mandate of a 2% inflation target and maximum employment, while noting that a numeric target for employment was inappropriate because labor markets are affected by many non-monetary factors that are beyond the control of the Fed’s monetary policy. Charlie always emphasized the benefits of the symmetry of the Consensus Statement’s dual mandate and how it was robust under different circumstances, was easy to understand and facilitated clear communications. Immediately following Jay Powell’s roll out of the Fed’s 2020 Strategic Plan in his Jackson Hole speech in August 2020, Charlie and I teamed up and wrote a critique that identified all of the flaws and asymmetries of the Fed’s new Strategic Plan and concluded that it would only be a matter of time before its flaws would be revealed (The Murky Future of Monetary Policy, October 1, 2020, Hoover Institution Working Paper). Subsequently, inflation soared and the Fed sat on its hands and delayed normalizing monetary policy. This will always be viewed as a major policy blunder, despite the Fed’s efforts to the contrary. Since then, Charlie and I teamed up and wrote several updated papers recommending changes in the Fed’s Strategy. The latest was published by the Wall Street Journal less than a month ago (“What the Federal Reserve Can Do to Help Itself,” July 24, 2025). Charlie passed away last week. I wish he was still around to see how the Fed’s newly revised statement in many ways reverted back to the 2012 Consensus Statement that he was so instrumental in crafting. We would be having a very lively conversation.


Levy Sees Trump Nominee Miran Pushing for Radical Changes in Governance of Fed
Here's a Podcast I did with Kathleen Hays on her Podcast Central Bank Central. We dig into some issues that will emerge when the Senate Banking Committee holds confirmation hearings on Stephen Miran, President Trump's nominee to be a Federal Reserve Governor. While financial markets are focusing on whether Miran's favoring lower rates may tilt the Fed toward monetary easing, far more important is Miran's dramatic proposals to reform the Federal Reserve's governance that could materially change its monetary policy deliberations as well as bank supervision and regulation.
What the Federal Reserve Can Do to Help Itself
Here's a new Wall Street Journal commentary piece by By Charles I. Plosser and Mickey D. Levy: President Trump’s threat to nominate a new Federal Reserve chairman who will lower interest rates is misguided. History suggests that the economy and financial markets perform best when the Fed prioritizes price stability, and performance suffers when other goals take precedence. A central bank operating independently generates the best outcomes.

Macro Minds With Kallum Pickering

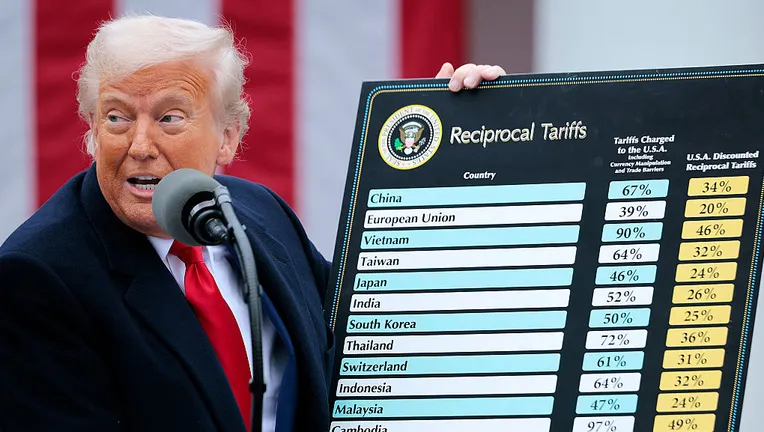
Trump’s Tariffs Capture a Plethora of Historic Mistakes
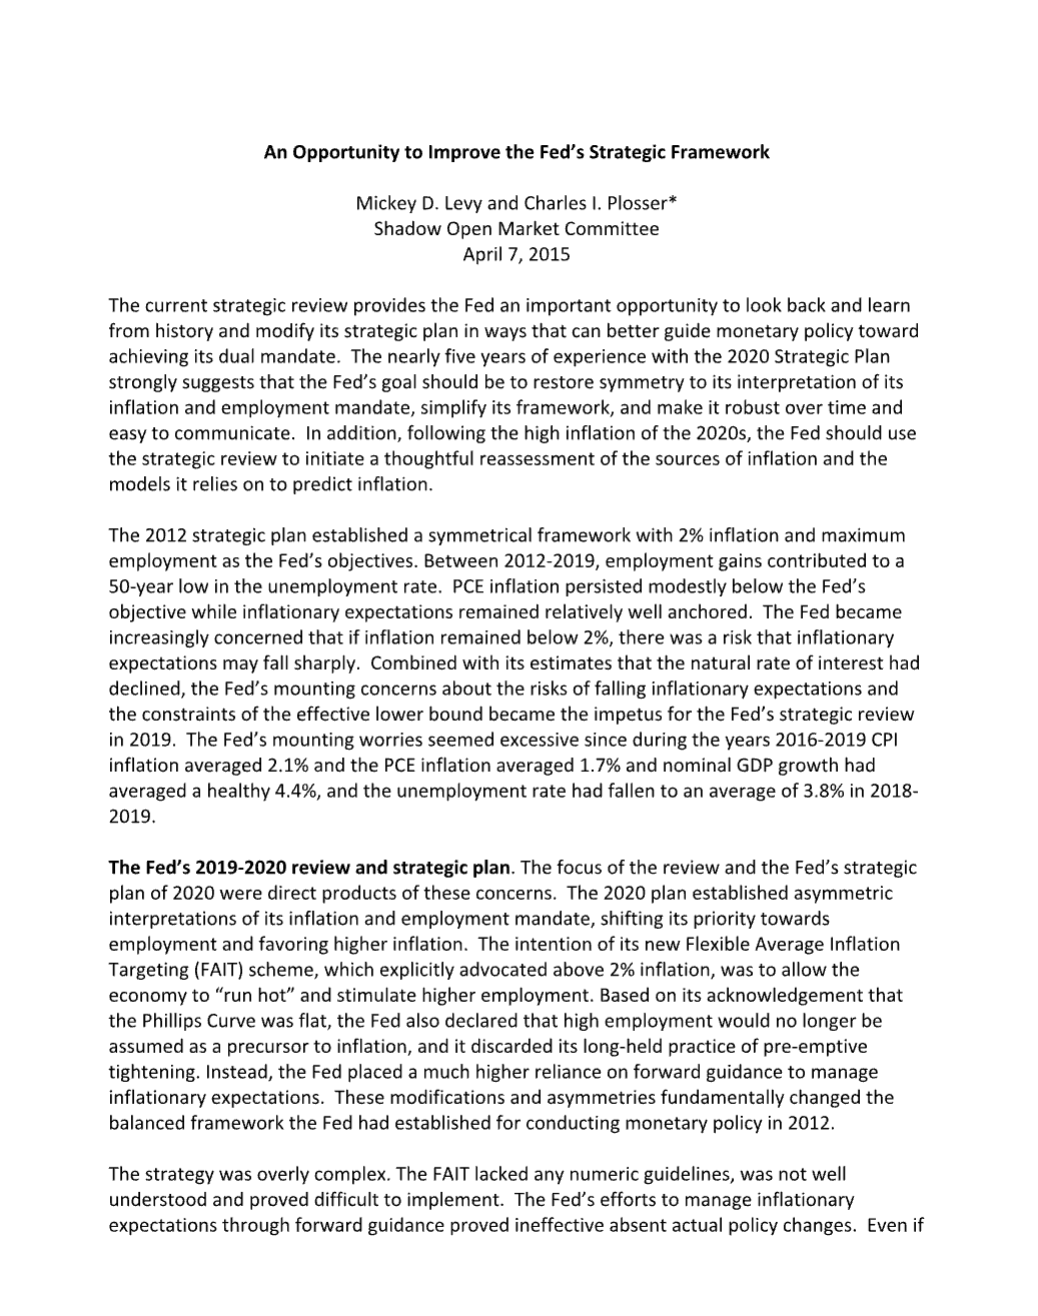
An Opportunity to Improve the Fed’s Strategic Framework
Yesterday, the Shadow Open Market Committee’s meeting in Washington, D.C. addressed issues of how the Fed may improve its policy framework.