Is the U.S. Economy Fragile or Resilient? And a Note on Aggregate Demand and Inflation
Last week the U.S. Department of Commerce announced that real GDP grew at a 1.5% annualized pace in 2026Q1. The media reports and commentary emphasized the weakness of the GDP Report: “U.S. Economic Growth Slows” and “Slow growth highlights economy’s fragile state." Indeed, growth of 1.5% is below standard estimates of sustainable potential growth. But a closer look at the composition of the GDP report and the circumstances suggests that “resilience” and “strength” are better characterizations of the economy than “fragile” or “weak."
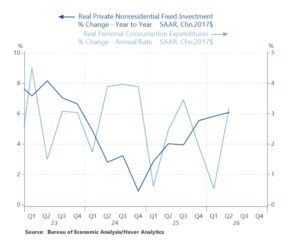
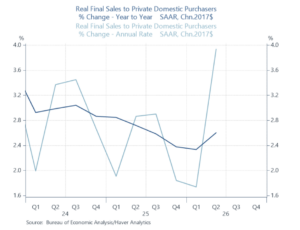
The composition of the 1.5% suggests strength in the domestic economy. Real consumption rose at a 3.2% annualized pace, contributing 2.1 percentage points to real GDP growth, and business fixed investment rose 8.4%, contributing 1.1ppt (Chart 1). Businesses liquidated inventories at a faster pace than Q1, which subtracted 0.7% from domestic production, while the trade deficit widened by $73 billion, reflecting healthy 4.5% growth in exports and an 11.5% rise in imports, which subtracted 1.0 ppt from real GDP. Residential investment, by far the weakest sector of the economy, rose modestly following five consecutive quarters of decline. Adding it up, inflation-adjusted aggregate demand was strong: final sales to domestic private purchasers rose 3.9% annualized, and final sales to domestic purchasers that includes the decline in government purchases rose 3.1% (Chart 2).
Chart 1. Real Business Fixed Investment and Personal Consumption
The context for evaluating the GDP report is important: economy has been hit by a series of supply shocks, including President Trump’s wrong-headed tariffs (and his erratic on-again, off-again implementation of them that has added uncertainty to conducting business), the clampdown on immigration, the high oil prices stemming from the U.S.-Iran war that have added significantly to inflation and business operating costs, and the positive impulse of the implementation and buildout of AI.
Chart 2. Real Final Sales to Private Domestic Purchasers
The tariffs are a negative shock to both supply and demand, which should reduce both aggregate demand and production. Economists in Spring 2025 argued that inflation would rise a lot and real growth would slow markedly, with some calling for recession. Neither happened. Unquestionably, the tariffs distorted production and supply chains and pushed up business operating costs and consumer prices and were distinctly negative for economic performance. Fortunately, households and businesses substituted away from tariffed goods and services, which mitigated the extent of the negative impacts.
The surge in oil prices operates as a negative supply shock that should reduce aggregate demand and raise the portion of it that is inflation and reduce the portion that is real. That didn’t happen either. Even though prices of gasoline and other energy sources surged with the higher oil prices, pushing up business operating costs and lowering real disposable income, aggregate demand accelerated. Business production and investment remained healthy, and consumers smoothed their real spending by drawing down their rate of personal saving and increasing their current dollar spending. The rate of personal saving (the portion of disposable income that is not spent; this measure does not include additions to the stock of wealth reflecting appreciation of financial and housing assets) has fallen from 5.2% in 2025Q1 to 2.8% in 2026Q2. This may have negative implications, as wealthier households spend more while lower income households are squeezed by the higher prices of gas and energy, but it also reflects the adjustability of the economy.
Businesses have been adjusting efficiently to the positive and negative supply shocks, and have liquidated inventories in every quarter since 2025Q2. Likely, this reflects caution in the face of uncertainties about tariffs and product demand, plus the real costs of financing the inventories. The inventory/sales ratio, both including and excluding motor vehicles, has declined since early 2025. This may reflect difficulties businesses have obtaining the products they need to meet demand, but it also reflects business efficiencies.
Business investment has been strong, obviously driven by the AI buildout, but investment in industrial equipment has risen at a healthy clip. Overall, businesses have benefited from the sustained healthy growth in product demand (despite the negative shocks of tariffs and higher oil prices, nominal GDP growth has accelerated) and technological innovations. This is reflected in reported growth in corporate revenues and profits.
The trade deficit has widened since the imposition of tariffs, contrary to the wish and prognostications of the Trump Administration, as growth in imports have outpaced growth in imports. (In nominal terms, the trade deficit has declined modestly.) The trade deficit widened significantly in 2025Q1 as businesses stocked up on imported inventories in anticipation of the tariffs and then fell in the following quarters. It has resumed rising in recent quarters amid rapid gains in both imports and exports. Without question, the tariffs have distorted imports and exports and harmed overall economic performance.
Chart 3. International Comparison of Real GDP, 2019Q4=100
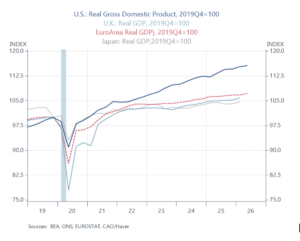
From a global perspective, the U.S. economy continues to outperform. U.S. real GDP growth is higher than every other advanced global economy (Chart 3), and its estimates of the U.S.’s potential growth are higher. Without question, the U.S.’s poor treatment of trading partners is inappropriate and forced changes in the global flows of trade will prove costly, the clampdown on immigration is having a measurable negative impact on labor force growth, and the U.S. faces thorny political-economic issues. Nevertheless, its performance has been resilient, and assessments of the GDP report that say the U.S. economy is fragile and weak are not supported by recent trends.
A note on aggregate demand and inflation. Inflation occurs when aggregate demand persistently exceeds aggregate supply. This demand-supply (im)balance is the macroeconomic environment that determines wage and price setting behavior. (Note that the Fed’s analysis and projections of inflation emphasize wage and price-setting behavior and how it is influenced by labor market tightness and inflationary expectations, while placing little emphasis on aggregate demand relative to productive capacity. This has been the source of its prior errors in judgment and policy.)
The sticky inflation in recent years has been driven by aggregate demand growing too fast (Chart 4). Nominal GDP, the broadest measure of current dollar spending that is a proxy for aggregate demand, doesn’t get much attention; when a GDP Report is released, the near-exclusive focus is on the real figure. That’s an oversight. Nominal GDP rose 7.9% annualized in Q2, lifting its yr/yr rise to 6.5%, up from 6.1% in Q1.
Chart 4. Nominal GDP Growth and PCE Inflation
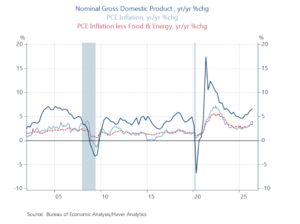
That’s far faster than growth in productive capacity, so it’s not surprising that inflation has remained sticky. (Two notes: 1) the surge in nominal GDP in 2021-2022 was a major contributor to the spike inflation; the Fed ignored the demand side of the equation and instead attributed the inflation to “transitory supply shock”, a glaring miss in economic reasoning and policy, and 2) in 2026Q2, while real GDP rose 1.5% annualized, the GDP deflator rose 6.25%, raising its yr/yr to 4.3%. This is a broader measure of inflation than the PCE Price Index, reflecting inflation in all aspects of GDP. In Q2, while the deflator of final sales to domestic purchasers rose 5.8% in Q2, lifting its yr/yr rise to 4.1%, the deflator of exports rose 25% annualized.)
Higher-than-desired inflation will persist as long as the growth in aggregate demand exceeds productive capacity by so much. The Fed and Congressional Budget Office estimate sustainable potential growth at 2.0%, with roughly 0.5% annual growth in the labor force and 1.5% growth in productivity. I’m more optimistic. But even if sustainable real growth is 2.25%-2.5% reflecting strong productivity gains driven by AI, then aggregate demand is growing too rapidly for inflation to recede. Stated differently, a moderation in aggregate demand is required to lower inflation.
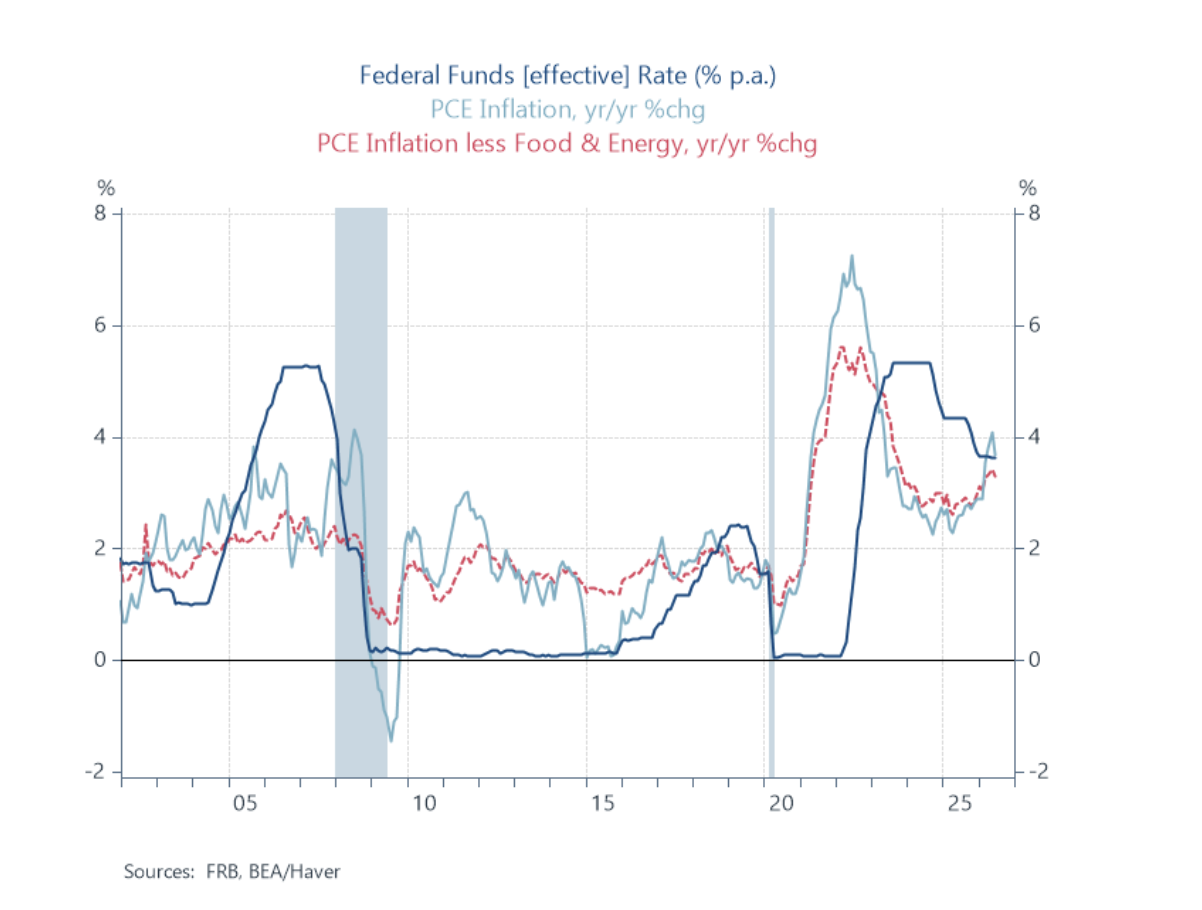
The Fed’s policy is contributing to the fast growth in aggregate demand, along with persistent deficit spending. Several indicators suggest that the Fed’s monetary policy may be too accommodative and generating the stronger growth in demand. The Fed funds rate is below PCE inflation (negative in real terms) and barely above core PCE inflation (Chart 5) (and is below the Fed’s longer-run 1% estimate it perceives would achieve its dual mandate of 2% inflation and maximum employment).
Chart 5. The Fed Funds Rate and PCE Inflation
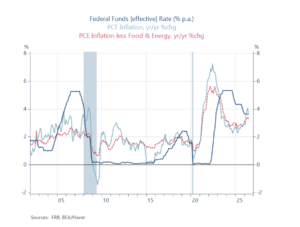
M2 money supply has picked up to 5.5% yr/yr growth, and money velocity (NGDP/M2) is rising, reflecting the lower demand for money as bond yields drift up (Note: the Fed virtually ignores money supply in its analysis of inflation). The Taylor Rule, a go-to estimate of the appropriate Fed funds rate that would achieve 2% inflation is now above 4% (The Fed does take into account the Taylor Rule, and includes as estimate of it in its Monetary Policy Report to Congress).
All of this suggests that while the Fed voted with three dissents to remain on hold at last week’s FOMC meeting, unless something changes dramatically, it seems likely that the Fed will need to raise rates in the future to slow aggregate demand to eventually achieve its 2% inflation target.
*Dr. Levy is a Visiting Fellow at the Hoover Institution at Stanford University and a member of the Shadow Open Market Committee.


Japan’s Economy, the Yen, and the Bank of Japan
Thesis: The Bank of Japan’s policy of zero interest rates and ongoing asset purchases is contributing to a weak yen and harming Japan's economy. Raising the BoJ’s policy rate toward its 2% target would contribute to an appreciation of the yen and boost the consumer and the economy. The BoJ’s policy rate has been zero or slightly negative for years and its massive asset purchases continue to balloon its balance sheet. This has served to distort financial markets but has not stimulated economic activity. The BoJ’s policy rate is now more than 2 percentage points below inflation. In other advanced nations, a rise in the central bank policy rate involves tighter monetary policy that weakens domestic demand. In Japan, following many years of zero or negative rates and asset purchases, normalizing monetary policy would enhance economic performance.
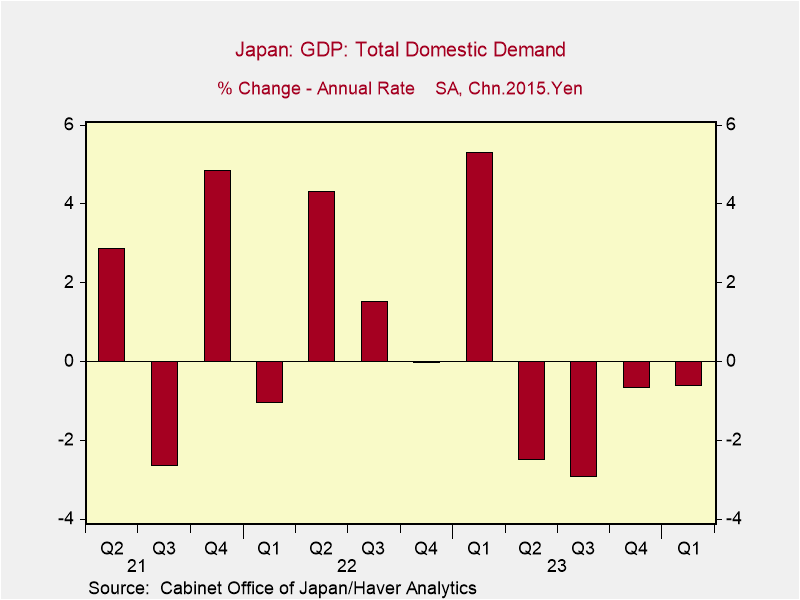
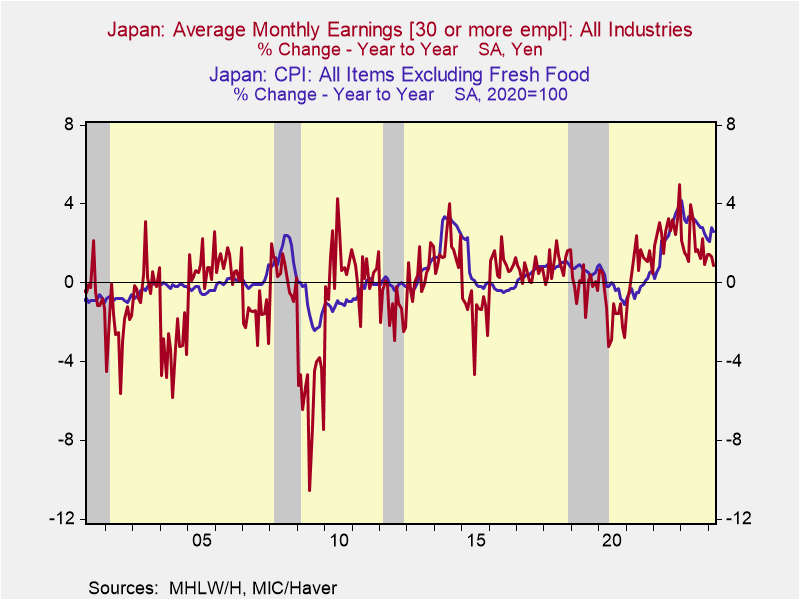
Japan's economy has struggled in the last year. Private consumption and gross business capital formation have each fallen in the last four consecutive quarters, reducing domestic demand (Chart 1). 2024Q1 was notably weak, with a 2% annualized decline in real GDP. Earnings have fallen behind inflation, cutting into purchasing power (Chart 2).
Chart 1. Japan Domestic Demand Chart 2. Earnings and Inflation
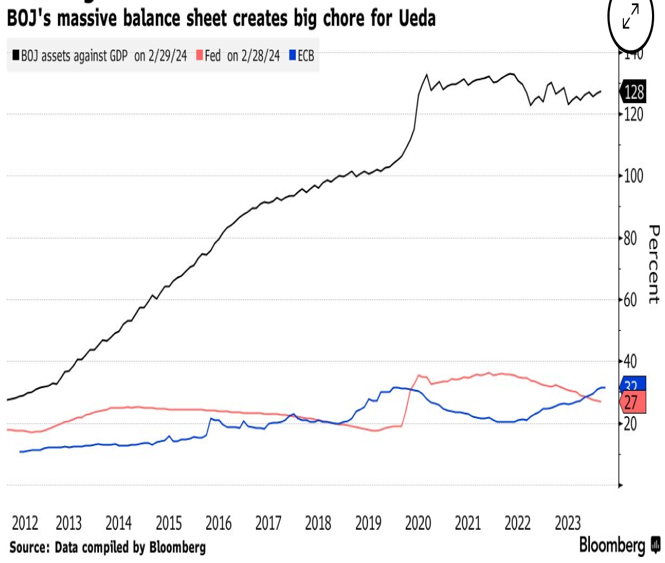
The BoJ's persistent zero (or slightly negative) interest rates have failed to stimulate aggregate demand and have served mostly to suppress debt service costs (including the government's) and distort financial markets and economic decisions. The BoJ's bloated balance sheet (its assets and liabilities) is dramatically higher as a percent of GDP than the Fed’s or ECB’s and magnitudes higher that any measure of reasonableness (Chart 3). Its asset purchases have created excess reserves in the banking system, the largest portion which are loaned back to the BoJ. The BoJ officially pays interest on excess reserves, which is tied to the BoJ’s policy rate and thus until recently has been zero. Commercial banks pay close to zero yields on deposits and generally have set rates on mortgages and consumer loans that provide positive returns to banks. Consumers lose from the BoJ’s policies.
Chart 3. The BoJ’s Balance Sheet/GDP Chart 4. The BoJ’s Policy Rate and Inflation
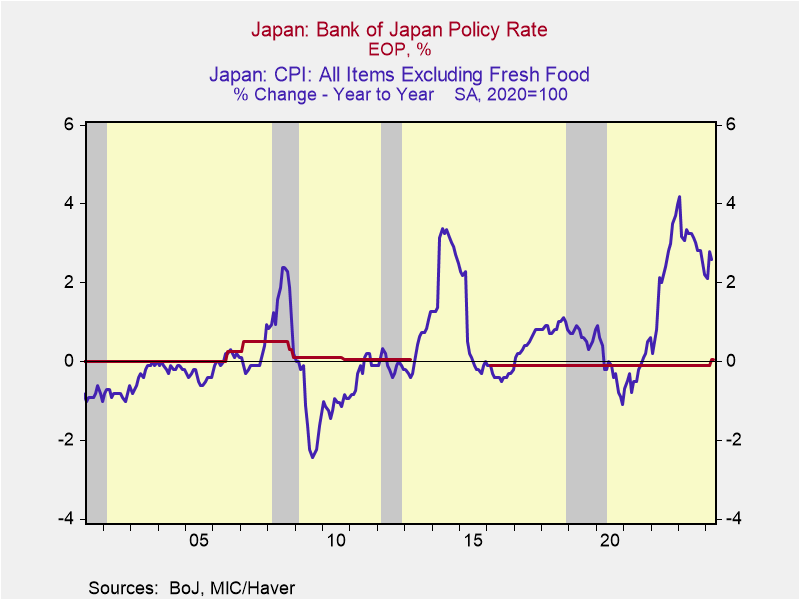
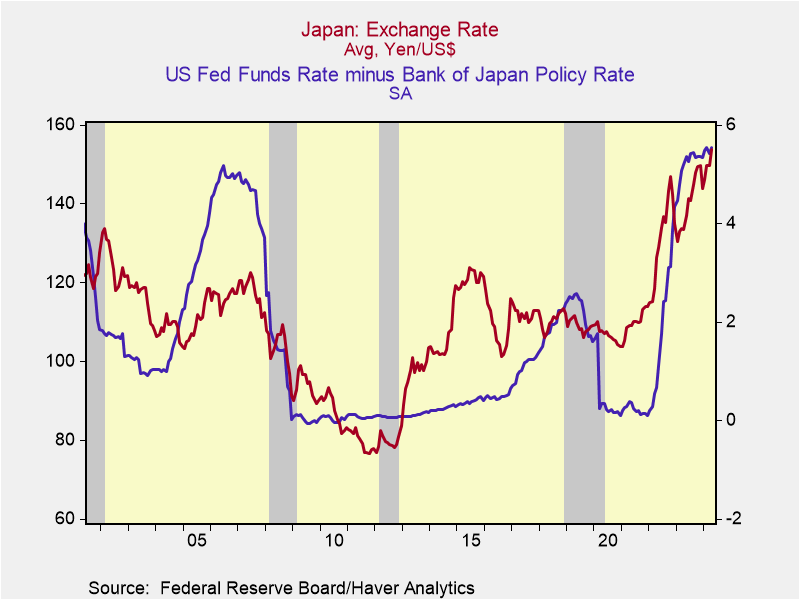
The divergent policies of the BoJ and the Fed have contributed to the marked weakness of the yen. In particular, the yen depreciated as the Fed raised rates in 2022 while the BoJ maintained a slightly negative real policy rate and its forward guidance suggested no future change. Even as the BoJ eased its yield curve control program, which allowed JGB yields to rise, the BoJ continued its asset purchases and the yen depreciation continued. Presently, the BoJ’s policy rate is more than 2 percentage points below inflation while the Fed’s policy rate (5.25%-5.5%) is roughly 2.5 percentage points above PCE inflation. Ex ante real JGBs are well below real US Treasury yields, although the comparison is clouded by the wide range of measures of Japanese inflationary expectations.10-year JGB yields have risen close 1% but inflationary expectations vary widely among different surveys and market-based measures. BoJ Governor Kazuo Ueda has indicated that longer-run inflation expectations are around 1.5%. 10-year Treasury bond yields of 4.5% are roughly 2 percentage points above inflationary expectations of 2.5%.
Chart 5. The Yen and Fed Funds Rate minus BoJ Rate
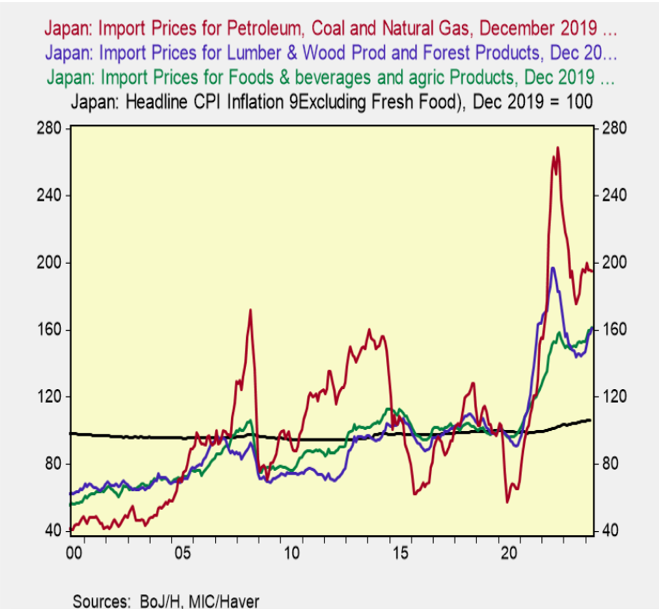
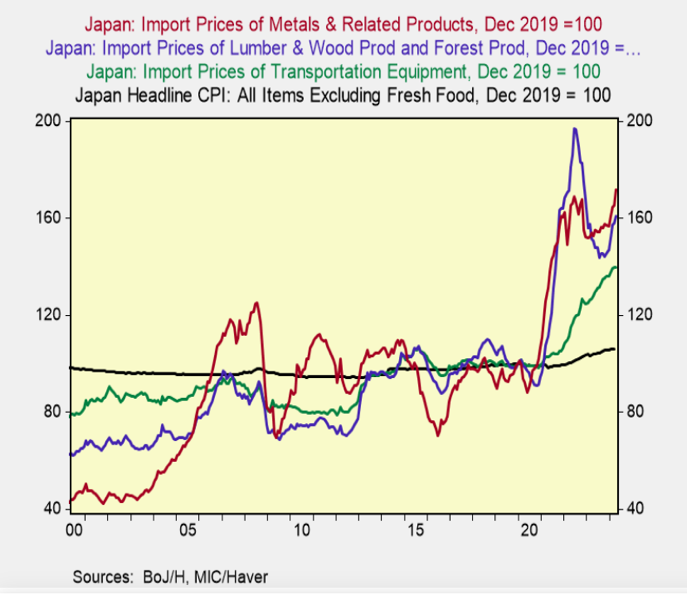
The weaker yen has benefited exporters by lowering their costs of production relative to overseas producers, but has raised the costs of imports. Japan's imports are a relatively high 18% of GDP. Japan imports nearly 100% of its oil and energy whose transactions are primarily US dollar-denominated. Prices of imported goods have risen dramatically: Chart 6 shows the cumulative price increases of goods that are consumer-oriented and Chart 7 shows cumulative price increases of goods used in production. Prices of oil and energy imports are included in Chart 6, but they affect production just as much. These high prices of imports have dented consumption and production, and they have also weighed on confidence.
Charts 6 and 7. Prices of Imported Goods, Consumer and Production-Related
Based on the higher inflation and rising inflationary expectations, and the burdens the weaker yen is imposing on Japan’s economy, the BoJ would be wise to raise its policy rate toward its 2% target and provide forward guidance that its intention is to normalize monetary policy. This would involve raising rates and implementing a gradual program of reducing its balance sheet. While the rate increases should begin immediately and continue through year-end 2025, the balance sheet adjustment necessarily must be slower. There are currently close to 3 trillion yen in excess reserves, and the BoJ holds large amounts of long-duration assets, including corporate bonds, and it also holds ETFs of equities, so a gradual unwind of the balance sheet would likely involve a 10-year program.
As the BoJ raises interest rates, commercial banks will profit from the sizable interest they receive from the BoJ on excess reserves. The steepening of the yield curve and higher interest margins will facilitate higher bank yields on deposits. Japanese pensions, including those managed by the Postal Saving System, and insurance companies will benefit. Consumers will be better off. It will take years to judiciously unwind the excess reserves in the banking system, such that bank lending is unlikely to be inhibited. The BoJ understands the negative impact of the weak yen on Japanese consumers and the economy. It’s only a matter of time before it raises rates.
Confidence will build as evidence shows economic improvement as the BoJ increases rates toward inflation and the yen appreciates. This will reinforce the yen and the domestic economy. The marked appreciation of the Nikkei has already begun to anticipate these favorable outcomes.