
Putting Current Bond Yields into Historical Perspective
By Mickey D. Levy
My key observation about the current angst about “high” bond yields: I much prefer high real interest rates associated with healthy economic growth and high returns to capital than low real interest rates associated with economic malaise and low expectations.
Also, while I have long argued that the persistently high government budget deficits and rising debt/GDP are a major problem that involve a misallocation of national resources and must be addressed, I’m not so sure that the recent rise in rates can be attributable to the government’s rising debt.
It’s a tossup between what was more illogical last week, the headlines lamenting “soaring bond yields” or U.S. Secretary of the Treasury Scott Bessent’s announcement that the Treasury had upped its bond buyback program with the hope of lowering yields on long-duration Treasury securities.
A bit of historical perspective is instructive. Current yields are not “soaring” or even “high”—they are in a range that is consistent with current economic and inflation conditions—and these levels are preferable to the low bond yields that characterized the troubled post-Great Financial Crisis period. And Bessent’s Wall Street career in fixed income presumably taught him that interventions aimed at manipulating the bond market would not work; clearly, his announced intervention was a political ploy to placate President Trump. It didn’t work. I strongly recommend Stanley Druckenmiller’s Wall Street Journal article “Let the Bond Market Speak”, August 25, 2026.
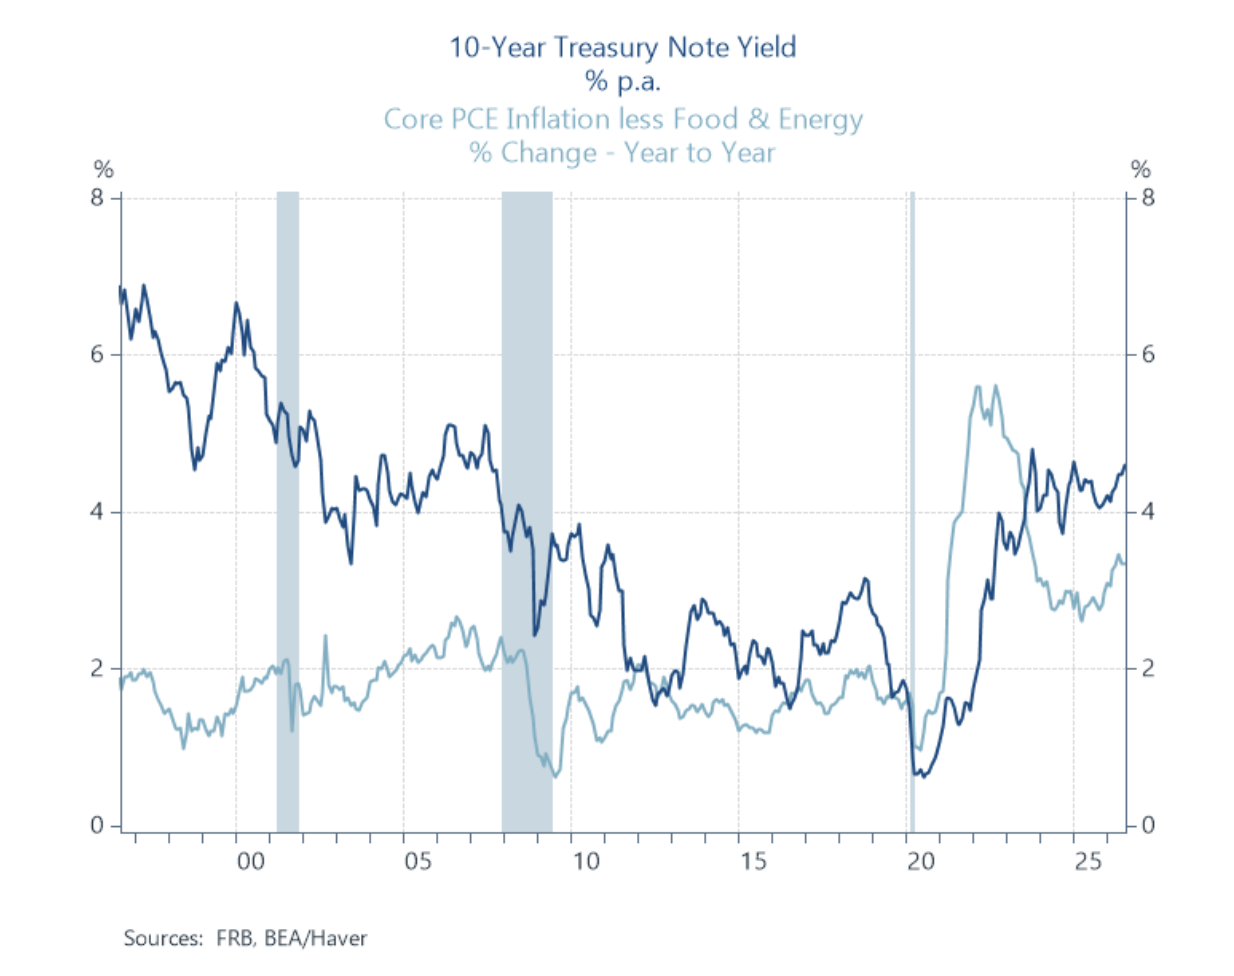
Currently, 10-year US Treasury yields are roughly 4.7%, up from 4.2% earlier in 2026. With inflationary expectations around 2.25%, real rates are in the 2.4%-2.5% range. It’s likely that real rates would be even higher if not for the Trump Administration’s tariffs, clampdown on immigration and other policies that have dampened real growth and threatened longer-run potential. Current real rates are above the low bond yields during 2010-2014 (they ranged between 2.5%-3.25%) that were associated with the disappointingly soft economic recovery from the Great Financial Crisis, lingering high unemployment and diminished expectations, the Fed’s zero interest rates and extended asset purchases and worries that inflation was too low, but significantly below the bond yields of the 1990s and modestly below those that prevailed during portions of the early 2000s.
A cursory comparison of recent decades suggests clearly that the post-GFC period was aberrant period. (Federal Reserve Bank of New York research “Measuring the Natural Rate of Interest”, 2026, estimates that the 2009-2014 period was the low point of the natural rate in modern history.) Yet many financial market participants and commentators use the low rates of that aberrant period as the benchmark for characterizing current yields as high and rising, when economic conditions are far different.
Chart 1 shows 10-year Treasury bond yields and core PCE inflation since 1990. Chart 2 shows the inflation-adjusted bond yields (a measure of inflationary expectations is not available back to 1990) and their correlation to productivity gains.
Chart 1. 10-Yr Treasury Yield and Core PCE inflation
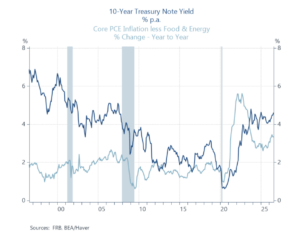
Chart 2. Productivity and 10-Yr Treasury Yields
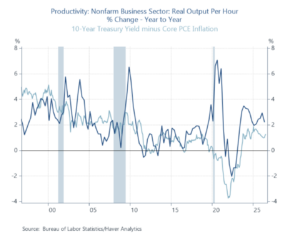
Bond yields were modestly higher in the early 2000s than currently, particularly in real terms, reflecting the economic growth of the period. Obviously, the debt-financed housing bubble and excesses in the MBS market were part of a misallocation of capital that precipitated the GFC.
The most instructive comparison is between current conditions and the 1990s. Bond yields in the 1990s were much higher than currently, in real and nominal terms, associated with solid productivity-driven economic growth, high returns to capital and high expectations. 10-yr Treasury yields hovered between 6.5%-7% during 1994-1997 and averaged 5.4% in 1998-1999, while inflation-adjusted yields were above 4% for most of the period.
The economic and financial highlights of the 1990s included strong growth and rising wealth (the stock market and housing appreciated faster than the economy); the Fed’s highly successful mid-expansion cycle tightening (February 1994-February 1995) that lowered inflationary expectations and resulted in a soft economic landing; Alan Greenspan’s pushback on tightening monetary policy in response to the strong growth and declining unemployment because he believed the productivity boom would lift real growth and constrain inflation; and strength in capital markets and subsequent decade-end surge in capital markets that culminated with the dot.com bubble.
As a side note, one big difference between the dot.com driven stock market of the late 1990s and the stock market of the 2020s is the dramatic speed of the implementation of AI into commerce and society and the magnitude of the revenues and profits of the AI industry, compared to the lack of revenues and profits of a majority of the dot.com firms of the 1990s.
A second side note contrasts the U.S. government budget in the 1990s to the current situation of worrisome budget deficits and rising debt, with some irony. In the 1990s, budget deficits shrank and toward decade-end, there were budget surpluses that shrank government debt outstanding. This trend reflected sizable declines in defense spending related to the “peace dividend” associated with the end of the cold war combined with the surge in tax revenues related to capital gains taxes generated by the strong stock market.
Fed Chair Greenspan subsequently testified to Congress that declines in government debt were potentially harmful to the US Treasury market and financial markets, and recommended tax cuts (“Outlook for the federal budget and implications for fiscal policy”, Committee on the Budget, U.S. Senate, January 25, 2001). However, while the government budget imbalance was improving in cash flow terms, it was deteriorating on an accrual basis, and longer-run projections of future deficits and debt were mounting, reflecting the pending retirement of the post-war baby boom generation.
Policymakers of the 1990s failed to address these issues, and those demographics now dominate the current budget and projections of the future. The shrinking government debt/GDP ratio in the 1990s played little role in the financial market debate about bond yields, whereas in the current environment even small moves in yields draw attention to the extraordinarily high and worrisome budget deficits and debt.
While I have long argued that the persistently high government budget deficits and rising debt/GDP are a major problem that involve a misallocation of national resources and must be addressed, I’m not so sure that the recent rise in rates can be attributable to the government’s rising debt.
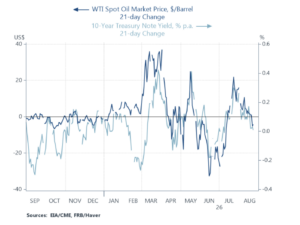
The bottom line is today’s real Treasury bond yields largely reflect the healthy economy and high expected returns on capital, despite erratic policies that constrain growth (Of course, other factors are at play; currently, as shown in Chart 3, high oil prices are clearly influencing bond yields.)
Chart 3. 21-day Change in WTI Oil Prices and 10-Yr Treasury Yield
That doesn’t mean that every investment in AI will provide a healthy return or that the economy will not hit speed bumps along the way. (Nor can the weak housing activity be blamed on “high” mortgage rates; that is attributable primarily to the 50% surge in home values in the early-2020s that the Fed contributed to). But it does reflect the historical perspective that interest rates tend to reflect the economic and inflation conditions of the day. I would prefer even higher real rates and a stronger real US dollar that would stem from reasonable and predictable pro-growth economic policies.
Dr. Levy is Visiting Fellow at the Hoover Institution at Stanford University and member of the Shadow Open Market Committee

Is the U.S. Economy Fragile or Resilient? And a Note on Aggregate Demand and Inflation
Last week the U.S. Department of Commerce announced that real GDP grew at a 1.5% annualized pace in 2026Q1. The media reports and commentary emphasized the weakness of the GDP Report: “U.S. Economic Growth Slows” and “Slow growth highlights economy’s fragile state." Indeed, growth of 1.5% is below standard estimates of sustainable potential growth. But a closer look at the composition of the GDP report and the circumstances suggests that “resilience” and “strength” are better characterizations of the economy than “fragile” or “weak."
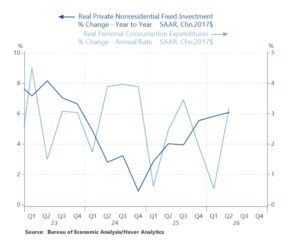
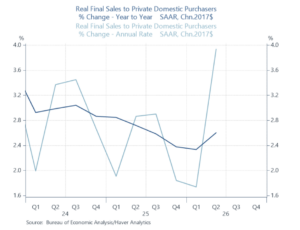
The composition of the 1.5% suggests strength in the domestic economy. Real consumption rose at a 3.2% annualized pace, contributing 2.1 percentage points to real GDP growth, and business fixed investment rose 8.4%, contributing 1.1ppt (Chart 1). Businesses liquidated inventories at a faster pace than Q1, which subtracted 0.7% from domestic production, while the trade deficit widened by $73 billion, reflecting healthy 4.5% growth in exports and an 11.5% rise in imports, which subtracted 1.0 ppt from real GDP. Residential investment, by far the weakest sector of the economy, rose modestly following five consecutive quarters of decline. Adding it up, inflation-adjusted aggregate demand was strong: final sales to domestic private purchasers rose 3.9% annualized, and final sales to domestic purchasers that includes the decline in government purchases rose 3.1% (Chart 2).
Chart 1. Real Business Fixed Investment and Personal Consumption
The context for evaluating the GDP report is important: economy has been hit by a series of supply shocks, including President Trump’s wrong-headed tariffs (and his erratic on-again, off-again implementation of them that has added uncertainty to conducting business), the clampdown on immigration, the high oil prices stemming from the U.S.-Iran war that have added significantly to inflation and business operating costs, and the positive impulse of the implementation and buildout of AI.
Chart 2. Real Final Sales to Private Domestic Purchasers
The tariffs are a negative shock to both supply and demand, which should reduce both aggregate demand and production. Economists in Spring 2025 argued that inflation would rise a lot and real growth would slow markedly, with some calling for recession. Neither happened. Unquestionably, the tariffs distorted production and supply chains and pushed up business operating costs and consumer prices and were distinctly negative for economic performance. Fortunately, households and businesses substituted away from tariffed goods and services, which mitigated the extent of the negative impacts.
The surge in oil prices operates as a negative supply shock that should reduce aggregate demand and raise the portion of it that is inflation and reduce the portion that is real. That didn’t happen either. Even though prices of gasoline and other energy sources surged with the higher oil prices, pushing up business operating costs and lowering real disposable income, aggregate demand accelerated. Business production and investment remained healthy, and consumers smoothed their real spending by drawing down their rate of personal saving and increasing their current dollar spending. The rate of personal saving (the portion of disposable income that is not spent; this measure does not include additions to the stock of wealth reflecting appreciation of financial and housing assets) has fallen from 5.2% in 2025Q1 to 2.8% in 2026Q2. This may have negative implications, as wealthier households spend more while lower income households are squeezed by the higher prices of gas and energy, but it also reflects the adjustability of the economy.
Businesses have been adjusting efficiently to the positive and negative supply shocks, and have liquidated inventories in every quarter since 2025Q2. Likely, this reflects caution in the face of uncertainties about tariffs and product demand, plus the real costs of financing the inventories. The inventory/sales ratio, both including and excluding motor vehicles, has declined since early 2025. This may reflect difficulties businesses have obtaining the products they need to meet demand, but it also reflects business efficiencies.
Business investment has been strong, obviously driven by the AI buildout, but investment in industrial equipment has risen at a healthy clip. Overall, businesses have benefited from the sustained healthy growth in product demand (despite the negative shocks of tariffs and higher oil prices, nominal GDP growth has accelerated) and technological innovations. This is reflected in reported growth in corporate revenues and profits.
The trade deficit has widened since the imposition of tariffs, contrary to the wish and prognostications of the Trump Administration, as growth in imports have outpaced growth in imports. (In nominal terms, the trade deficit has declined modestly.) The trade deficit widened significantly in 2025Q1 as businesses stocked up on imported inventories in anticipation of the tariffs and then fell in the following quarters. It has resumed rising in recent quarters amid rapid gains in both imports and exports. Without question, the tariffs have distorted imports and exports and harmed overall economic performance.
Chart 3. International Comparison of Real GDP, 2019Q4=100
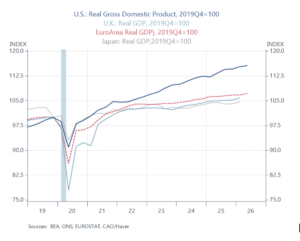
From a global perspective, the U.S. economy continues to outperform. U.S. real GDP growth is higher than every other advanced global economy (Chart 3), and its estimates of the U.S.’s potential growth are higher. Without question, the U.S.’s poor treatment of trading partners is inappropriate and forced changes in the global flows of trade will prove costly, the clampdown on immigration is having a measurable negative impact on labor force growth, and the U.S. faces thorny political-economic issues. Nevertheless, its performance has been resilient, and assessments of the GDP report that say the U.S. economy is fragile and weak are not supported by recent trends.
A note on aggregate demand and inflation. Inflation occurs when aggregate demand persistently exceeds aggregate supply. This demand-supply (im)balance is the macroeconomic environment that determines wage and price setting behavior. (Note that the Fed’s analysis and projections of inflation emphasize wage and price-setting behavior and how it is influenced by labor market tightness and inflationary expectations, while placing little emphasis on aggregate demand relative to productive capacity. This has been the source of its prior errors in judgment and policy.)
The sticky inflation in recent years has been driven by aggregate demand growing too fast (Chart 4). Nominal GDP, the broadest measure of current dollar spending that is a proxy for aggregate demand, doesn’t get much attention; when a GDP Report is released, the near-exclusive focus is on the real figure. That’s an oversight. Nominal GDP rose 7.9% annualized in Q2, lifting its yr/yr rise to 6.5%, up from 6.1% in Q1.
Chart 4. Nominal GDP Growth and PCE Inflation
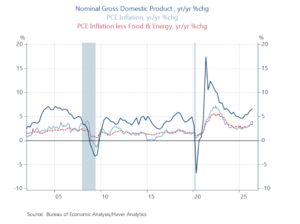
That’s far faster than growth in productive capacity, so it’s not surprising that inflation has remained sticky. (Two notes: 1) the surge in nominal GDP in 2021-2022 was a major contributor to the spike inflation; the Fed ignored the demand side of the equation and instead attributed the inflation to “transitory supply shock”, a glaring miss in economic reasoning and policy, and 2) in 2026Q2, while real GDP rose 1.5% annualized, the GDP deflator rose 6.25%, raising its yr/yr to 4.3%. This is a broader measure of inflation than the PCE Price Index, reflecting inflation in all aspects of GDP. In Q2, while the deflator of final sales to domestic purchasers rose 5.8% in Q2, lifting its yr/yr rise to 4.1%, the deflator of exports rose 25% annualized.)
Higher-than-desired inflation will persist as long as the growth in aggregate demand exceeds productive capacity by so much. The Fed and Congressional Budget Office estimate sustainable potential growth at 2.0%, with roughly 0.5% annual growth in the labor force and 1.5% growth in productivity. I’m more optimistic. But even if sustainable real growth is 2.25%-2.5% reflecting strong productivity gains driven by AI, then aggregate demand is growing too rapidly for inflation to recede. Stated differently, a moderation in aggregate demand is required to lower inflation.
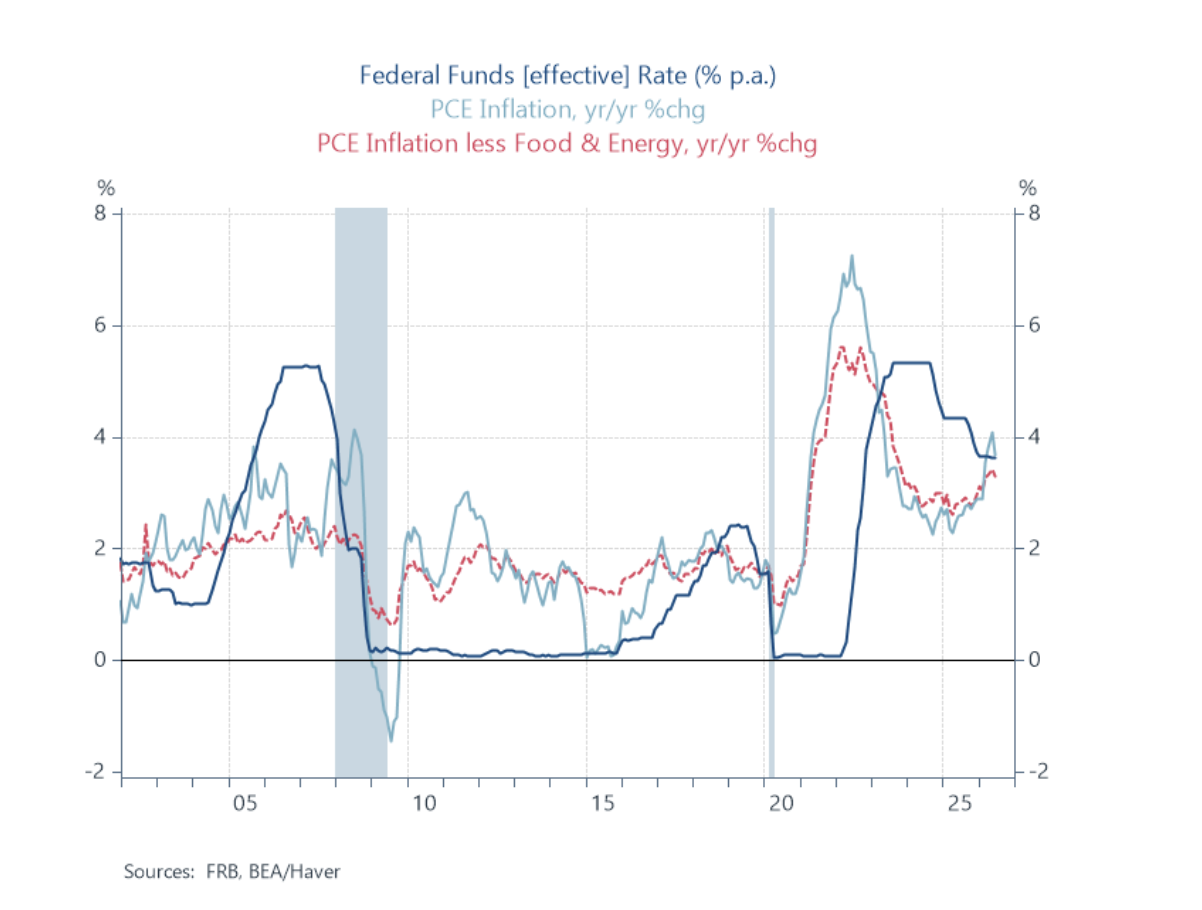
The Fed’s policy is contributing to the fast growth in aggregate demand, along with persistent deficit spending. Several indicators suggest that the Fed’s monetary policy may be too accommodative and generating the stronger growth in demand. The Fed funds rate is below PCE inflation (negative in real terms) and barely above core PCE inflation (Chart 5) (and is below the Fed’s longer-run 1% estimate it perceives would achieve its dual mandate of 2% inflation and maximum employment).
Chart 5. The Fed Funds Rate and PCE Inflation
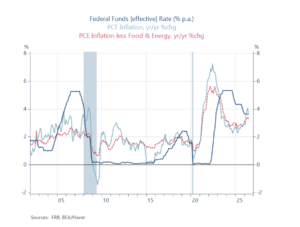
M2 money supply has picked up to 5.5% yr/yr growth, and money velocity (NGDP/M2) is rising, reflecting the lower demand for money as bond yields drift up (Note: the Fed virtually ignores money supply in its analysis of inflation). The Taylor Rule, a go-to estimate of the appropriate Fed funds rate that would achieve 2% inflation is now above 4% (The Fed does take into account the Taylor Rule, and includes as estimate of it in its Monetary Policy Report to Congress).
All of this suggests that while the Fed voted with three dissents to remain on hold at last week’s FOMC meeting, unless something changes dramatically, it seems likely that the Fed will need to raise rates in the future to slow aggregate demand to eventually achieve its 2% inflation target.
*Dr. Levy is a Visiting Fellow at the Hoover Institution at Stanford University and a member of the Shadow Open Market Committee.

Could “Temporary Deflation” follow the “Temporary Oil-Driven Spike in Inflation”?
*The dramatic spike in oil prices generated 3 months of outsized increases in CPI and PCE inflation that pushed up their yr/yr measures.
*The Fed has kept rates on hold and did not accommodate the negative supply shock, core inflation measures have not increased much, and inflationary expectations have remained anchored.
*Oil prices have fallen sharply, and if current prices stick close to current levels (around or below $75/barrel)—which is uncertain as inventories need rebuilding–continued rapid price declines in gasoline and other energy may result in several months of declines in the CPI and PCE Price Index.
*This would ease some price pressures on consumers and let the Fed breath more easily.
In a note in mid-April, I described how the spike in oil prices from $65/barrel to $95/bbl would temporarily boost the monthly inflation data for about three months as retail prices adjusted to the higher oil prices. I emphasized the importance of the Fed not accommodating the negative supply shock, which would keep its impacts temporary, limit the pass through of the higher oil prices to the prices of nonenergy goods and services, and constrain inflationary expectations. I noted that if oil prices remained around $95/bbl, after several months of outsized increases, the monthly inflation data would revert to their prior increases, while their yr/yr measures would rise to absorb the temporary monthly spikes.
I continued: “However, if oil prices fall, subsequent months’ CPI and PCE Price Index data would possibly decline, and the temporary months of deflation would reduce the general price level from its oil price-driven peak.” That process is now beginning to unfold. Yippee: a positive supply shock that involves a partial reversal of the negative supply shock imposed by the conflict in the Middle East and relief to consumers and businesses.
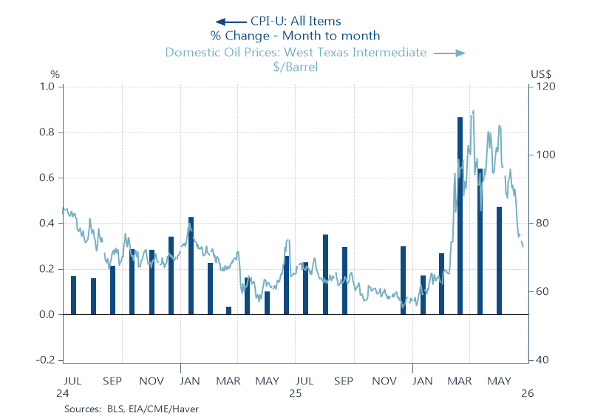
Here’s the situation: in the prior 12 months through February 2026, CPI inflation was 2.4%, averaging a 0.2% increase per month, while PCE inflation was 2.9%, averaging a 0.3% rise per month. The oil price spike pushed up CPI inflation 0.9%, 0.6% and 0.5% in March, April and May, lifting its yr/yr inflation to 4.2% in May, while PCE inflation rose 0.7% and 0.4% in March and April, lifting its inflation to 3.8% in April (PCE inflation for May will be reported tomorrow). See Chart 1. During these months, both core CPI inflation and PCE inflation rose a bit (CPI: 0.2%, 0.4% and 0.2%; PCE: 0.3% and 0.2%), but the details of the CPI indicate that the pass through of the oil price spike was fairly limited to specific categories, including energy services (electricity and utilities) and airline fares. Most categories in the CPI showed little effect of the higher oil prices.
Chart 1. CPI Inflation and WTI Oil Prices
The fall in oil prices will start to show up in the June inflation data and be much more pronounced in the July data. Declines in monthly CPIs are fairly rare, but do occur, particularly when large declines in oil prices generate falling gas and energy prices, like in late 2014).
WTI oil prices averaged $97.8/bbl in May and have fallen sharply, averaging $75/barrel in the last week. At this writing, they are around $72/bbl. The speed of the decline in crude oil prices has been impressive, and contrary to the warnings by oil experts that the rebuilding of global oil inventories would keep oil prices high. Thanks to the ramping up of domestically-produced oil, refined products are plentiful. So far, retail gasoline prices have also fallen rapidly, consistent with their historical pattern of adjusting quickly to changes in crude oil prices (Chart 2).
Charts 2. WTI Oil Prices and Retail Gas Prices
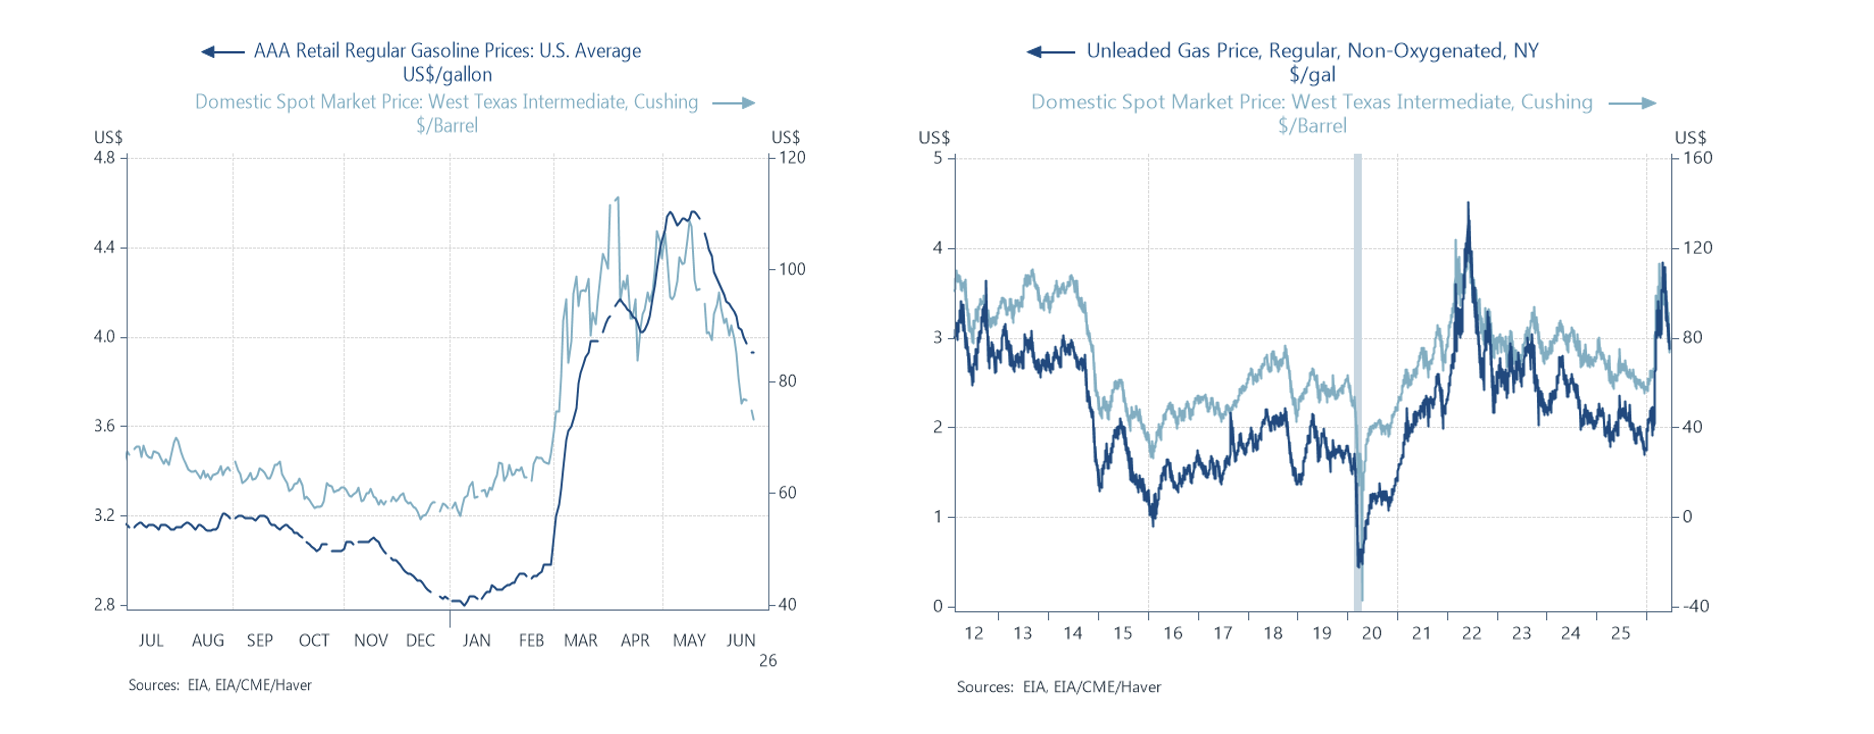
In the first three weeks of June, when oil prices have averaged approximately $86.5/bbl, gasoline prices averaged $4.16/gallon, down from their $4.50/gallon average in May. These declines in retail gas prices should be reflected in the June inflation data, enough to ease the monthly increase in the CPI and PCE Price Index. The CPI should also get some relief from lower prices of airfares, where anecdotal evidence suggests some easing of prices. On the other hand, energy-related surcharges on distribution costs and other services are expected to be slower to adjust to the lower gasoline and energy prices.
If oil prices hold anywhere close to current levels, outright declines in the monthly inflation measures would be likely. They would reduce the yr/yr inflation back toward its pre-oil price spike levels. That would make the March-May oil price shock truly temporary.
A note on the term “temporary”. The Fed’s reference to the surge in inflation beginning in 2021 as a “transitory supply shock” was erroneous and misguided. While the Covid pandemic bottled up global supply chains and was a temporary negative shock to supply, the unprecedented fiscal and monetary stimulus (deficit spending was increased by 25% of GDP and the Fed reduced rates to zero and effectively purchased one-half of the increase in Treasury bond issuance) generated the strongest acceleration of aggregate demand in modern U.S. history, which obviously contributed to the high inflation. The Fed, which had presumed inflation would stay low as it did during the recovery from the Great Financial Crisis, called the rise in inflation “transitory”, and subsequently, it purposely chose to understate (ignore) its role in generating the surge in inflation, instead blaming it on a negative supply shock. Also, remember that after the surge in inflation, the Fed emphasized that its goal was to reduce inflation to 2%, thus accepting the permanently higher general price level that it had contributed to.
In response to the recent oil price shock, if the Fed had accommodated it, the temporarily higher monthly inflation could have become a more permanent one. But the Fed wisely kept monetary policy on hold, so its inflationary impact will be temporary. Now, the lower oil prices hold the prospect that the general price level will fall and partially reverse some of its sharp rise during the negative supply shock.
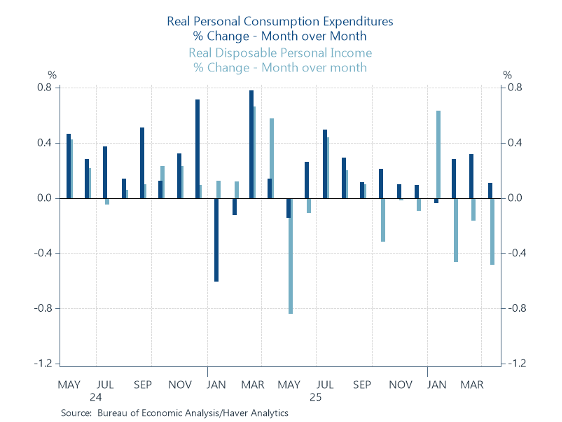
Consumer spending patterns. Consumers have remained resilient. While the three months of spikes in inflation have resulted in declines in real disposable personal income, inflation-adjusted consumption has continued to rise (Chart 3). On average, consumers have drawn down their rate of personal saving of disposable income and smoothed spending (in April, the rate of personal saving fell to 2.6%, close to an all-time low). The continued rise in consumption has been aided by several factors: following a period of weakness, employment payrolls have increased in each of the last three months; last year’s tax cut package increased tax rebates in Spring 2026; and rising household net worth has supported higher propensity to spend. Of note, in contrast to prior surges in oil and gas prices, motor vehicle sales rose a bit during the three months March-April-May when gasoline prices surged.
An easing of inflation–or better yet a reversal of the recent inflation spikes with some temporary (couple of months) of deflation–would provide relief for consumers and increase their purchasing power. That relief would come during peak seasons for driving and electrical services usage
Chart 3. Real Consumption and Disposable Income
The Fed’s monetary policy. The Fed is to be commended for not accommodating the negative oil supply shock. At its June FOMC meeting and at Kevin Warsh’s first post-FOMC meeting press conference, Warsh made clear that reducing inflation to the Fed’s 2% target was a priority, and he moved away from the Fed’s earlier characterization that monetary policy was mildly restrictive. In its updated June Summary of Economic Projections, the FOMC members estimated that a rate hike may be appropriate to be consistent with its dual mandate. But the FOMC member dots are not binding, and subject to changing conditions.
Could a bout of temporary deflation change the monetary policy landscape? Yes. Of course, the Fed’s monetary policy deliberations would depend on core inflation, but several months of deflation would raise the real Fed funds rate and change the environment. Warsh and the Fed favor lower inflation, but Warsh is also practical. I doubt if the Fed would vote to raise rates in an environment in which the general price level is declining.
Stay tuned.
Are Current Credit Conditions Worrisome?
In an interview earlier this week, Jamie Dimon, CEO of JPMorgan, said "banking rivals are doing dumb things" and drew parallels between current credit conditions and those in the years leading up to the 2008-2009 Great Financial Crisis. Immediately following Dimon's interview, the FDIC issued its "Quarterly Banking Profile,” which provided evidence that commercial banks are in sound shape financially, with relatively high levels of capital and fairly low loan delinquencies. Private credit has also been in the news, fueling fears of real problems. Private credit is not supervised and there are no reliable sources of data for evaluating private credit. This makes financial markets vulnerable to speculation and anecdotal evidence.
Are current credit conditions worrisome? My current assessment is that as long as the economy continues to expand, with aggregate demand growing anywhere near its recent pace, commercial bank credit is not worrisome, and credit conditions are far different than the problems and risks that characterized the pre-GFC period. If the economy were to fall into recession, resulting in a decline in business revenues and profits, credit problems would obviously emerge, but current monetary and fiscal policies suggest the probability of that outcome is low.
The rapid growth of private credit may be a problem. However, if problems exist, most likely they are largely concentrated in the debt-financed AI infrastructure buildout, and a deterioration in private credit conditions would have localized economic and financial impacts, unlike the GFC. Unfortunately, there is insufficient collected information and data to assess the situation, so understanding the scope of the credit issue must be based on specific credits, cash flows and capital of companies.
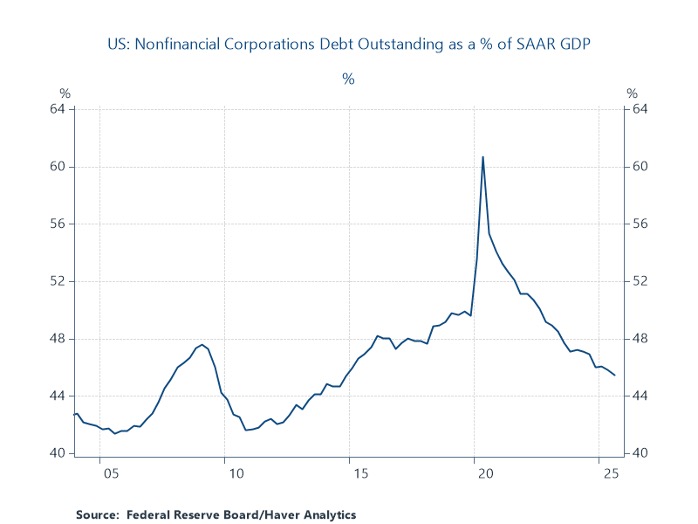
Dimon's concerns about parallels to the pre-GFC credit markets seem overstated. Consumer and business debt and debt-service are in fairly good shape and current credit conditions and banking practices are far different than during the pre-GFC. Corporate America has been deleveraging for years, household debt remains relative low compared to disposable personal income, and commercial banks are largely well capitalized and have a better understanding of the risks in their balance sheets.
In the years leading up to the GFC, nearly the opposite unfolded. There was an explosion of mortgage debt during an unruly bubble in housing activity (national outstanding mortgages rose 75% in the years 2002-2008) driven by rapidly rising home values and excessively loose credit standards (mortgages, HELOCs, home equity loans); a proliferation of overly-complex MBS and ABS derivatives that created tranches of income-yielding securities that were widely held by banks and investors who didn't know their risks; and insufficient bank capital and lax definitions of capital held by banks. Expectations that home values would continue to rise forever were the catalyst that drove the housing and mortgage demand and loose bank credit standards and willingness to hold complex and risky MBS derivatives. There was a high degree of interconnectedness of systematically important financial institutions (SIFIs) that risked contagion.
When home prices and expectations of future values began to fall in Spring 2006, the entire mortgage market began to unravel. Collapsing values of MBS derivatives and massive mortgage defaults resulted in back-breaking losses for banks, revealing insufficient bank capital bases. Widespread uncertainties about banks' capital led to a short-term funding crisis for large banks, a dramatic spike in uncertainty and broader financial paralysis and deep economic contraction. In sum, real estate loans were at the heart of commercial banking portfolios, and the credit quality of the loans were rotten.
The most recent Federal Reserve reports on commercial bank balance sheets and household debt along with the FDIC Report show that household and business debt levels are not high relative to economic activity and disposable personal income, and banks remain healthy and well-positioned. Chart 1 shows total household debt including mortgages as relatively low as a share of disposable income while Chart 2 shows that business debt is falling as a share of GDP. Chart 3 shows the shares of consumer loans by type: excluding the policy-induced spike in student loan delinquencies, the only concern is credit card debt where seriously-delinquencies are uncomfortably high. Chart 4 shows delinquencies of business loans: delinquencies of commercial real estate loans have risen only modestly since the Covid-related spike in commercial real estate vacancies in big cities and remain below delinquencies of residential real estate loans. Recent indicators suggest that the problems in commercial real estate are now diminishing.
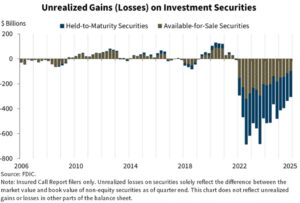
Charts 5-7 are from the recent FDIC Report: they show that banks' past-due loans and leases and charge-offs are relatively low; their reserve coverage ratio is relatively high; and their unrealized capital losses of investment securities is shrinking (banks have reduced the duration of their securities and longer-term yields have declined). The FDIC tabulation of problem banks is low. All-in-all, commercial banks are in relatively good shape.
The private credit market remains murky, except for those who are directly involved — the lenders and their sources of capital and leverage--and have access to the financials of the credits they are involved in. The lower costs and higher efficiencies of private lending that stems from lower costs of supervision and government regulatory oversight has a downside: lack of knowledge of data and transparency. In a recent study by the Alternative Credit Council and Houlihan Lukey, Financing the Economy 2025, the private credit market is described in broad terms and includes many interviews with active private creditors, but it does not include the sufficient data to analyze and evaluate private credit. (In a recent article I co-authored with Amit Seru, “The Fed Needs to Earn Its Independence. Just Setting Rates Isn’t Enough,” we argued that the Federal Reserve should seek to obtain information on the credit activities of the private lenders.)
It's important to distinguish between the different kinds and structures of private credit. Some (many?) private creditors are basically making the loans that commercial banks used to make, benefiting from the lower costs of supervision, compliance and regulation. They raise private capital, leverage it with loans from commercial banks, and provide credit to borrowers at healthy spreads. They conduct credit analyses of their clients. Presumably, the credit quality of their loans does not deviate significantly from the commercial and industrial (C&I) loans of commercial banks, although that is not ensured. Also, it is likely that most private creditors are less leveraged than banks.
Two of the largest concerns with private credit are 1) that the proliferation of private lending may be diluting the quality of the private creditors and lessening their credit standards and oversight of the loans, and 2) some private lenders have a narrow focus of their lending activities, and their lack of sufficient diversification may generate concentrations of defaults.
Currently, there's a ton of news on the rising debt used in the AI infrastructure buildout, including data centers and energy production facilities. Sorting out the corporate finances of the companies leading the AI capital spending buildout is difficult. For many companies involved in the AI buildout, much of the capital spending on data centers and energy related buildouts has been financed with internal capital and cash flows. More recently, however, a significant amount has been financed by debt. At the same time, the revenues and free cash flows generated by AI-related products are accelerating dramatically. Based on standard business metrics, a snapshot of the finances of many of the largest AI firms are reasonable or even good. Several may be problematic.
The pace of implementation of AI into commerce and society is stunning. Most likely it will add materially to productivity, economic growth and profits, and will disrupt labor markets. As with all other innovations in U.S. history, disruptions will result in some jobs lost and other new jobs created. I take a positive view of longer-run outcomes. In weighing current commentary on the labor market outcomes stemming from AI innovations, be careful in extrapolating anecdotal evidence to the entire economy, and remember the adage “bad news sells.”
As with all episodes of technological innovation in the U.S., there will be some failures among the AI innovators, and some of the providers of capital and credit will incur losses. However, in contrast to the GFC, the losses will be incurred by a narrow group of capital and credit providers and will not be pervasive and unhinge society and commercial banking. Consider an insurance company or a state pension that finances an AI project and incurs a sizable loan default or capital loss. The jarring impacts of the losses will be narrowly focused and would be relatively minor to the broader commercial banking industry. Similarly, the impacts of the large losses stemming from the Covid-initiated collapse of commercial real estate in big cities were relatively narrow and didn’t unhinge the banking industry. The private credit industry and AI require scrutiny. A close assessment of individual company products, revenues and profits and capital spending is required. This may be a time to be cautious in private lending. But starting with the premise that we should be fearful because it has parallels to the pre-GFC period is not particularly instructive.
Chart 1. Household Debt Outstanding/Disposable Personal Income
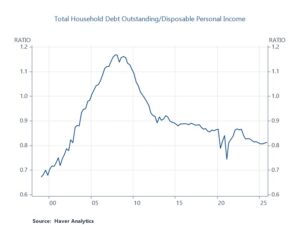
Chart 2. Non-financial Corporate Debt/GDP
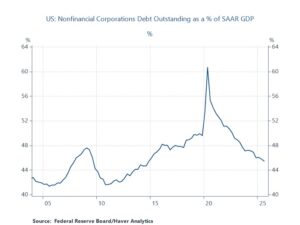
Chart 3. Seriously Delinquent Consumer Loans and Mortgages
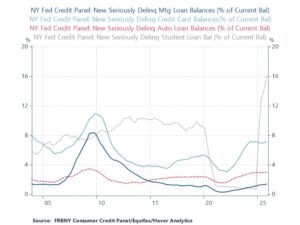
Chart 4. Delinquencies of Business Loans
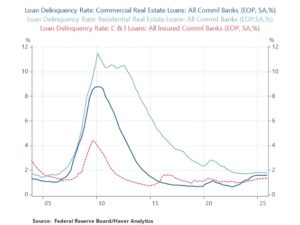
Chart 5. Past-Due and Charge-Off Rate
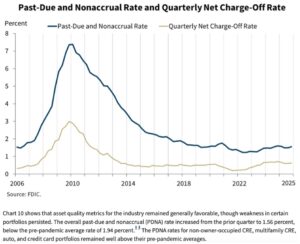
Chart 6. Bank Reserve Coverage Ratio
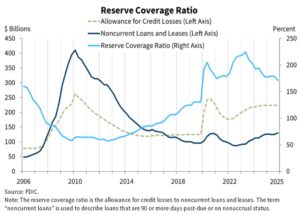
Chart 7. Unrealized Losses on Bank Investment Securities