Are Current Credit Conditions Worrisome?
In an interview earlier this week, Jamie Dimon, CEO of JPMorgan, said "banking rivals are doing dumb things" and drew parallels between current credit conditions and those in the years leading up to the 2008-2009 Great Financial Crisis. Immediately following Dimon's interview, the FDIC issued its "Quarterly Banking Profile,” which provided evidence that commercial banks are in sound shape financially, with relatively high levels of capital and fairly low loan delinquencies. Private credit has also been in the news, fueling fears of real problems. Private credit is not supervised and there are no reliable sources of data for evaluating private credit. This makes financial markets vulnerable to speculation and anecdotal evidence.
Are current credit conditions worrisome? My current assessment is that as long as the economy continues to expand, with aggregate demand growing anywhere near its recent pace, commercial bank credit is not worrisome, and credit conditions are far different than the problems and risks that characterized the pre-GFC period. If the economy were to fall into recession, resulting in a decline in business revenues and profits, credit problems would obviously emerge, but current monetary and fiscal policies suggest the probability of that outcome is low.
The rapid growth of private credit may be a problem. However, if problems exist, most likely they are largely concentrated in the debt-financed AI infrastructure buildout, and a deterioration in private credit conditions would have localized economic and financial impacts, unlike the GFC. Unfortunately, there is insufficient collected information and data to assess the situation, so understanding the scope of the credit issue must be based on specific credits, cash flows and capital of companies.
Dimon's concerns about parallels to the pre-GFC credit markets seem overstated. Consumer and business debt and debt-service are in fairly good shape and current credit conditions and banking practices are far different than during the pre-GFC. Corporate America has been deleveraging for years, household debt remains relative low compared to disposable personal income, and commercial banks are largely well capitalized and have a better understanding of the risks in their balance sheets.
In the years leading up to the GFC, nearly the opposite unfolded. There was an explosion of mortgage debt during an unruly bubble in housing activity (national outstanding mortgages rose 75% in the years 2002-2008) driven by rapidly rising home values and excessively loose credit standards (mortgages, HELOCs, home equity loans); a proliferation of overly-complex MBS and ABS derivatives that created tranches of income-yielding securities that were widely held by banks and investors who didn't know their risks; and insufficient bank capital and lax definitions of capital held by banks. Expectations that home values would continue to rise forever were the catalyst that drove the housing and mortgage demand and loose bank credit standards and willingness to hold complex and risky MBS derivatives. There was a high degree of interconnectedness of systematically important financial institutions (SIFIs) that risked contagion.
When home prices and expectations of future values began to fall in Spring 2006, the entire mortgage market began to unravel. Collapsing values of MBS derivatives and massive mortgage defaults resulted in back-breaking losses for banks, revealing insufficient bank capital bases. Widespread uncertainties about banks' capital led to a short-term funding crisis for large banks, a dramatic spike in uncertainty and broader financial paralysis and deep economic contraction. In sum, real estate loans were at the heart of commercial banking portfolios, and the credit quality of the loans were rotten.
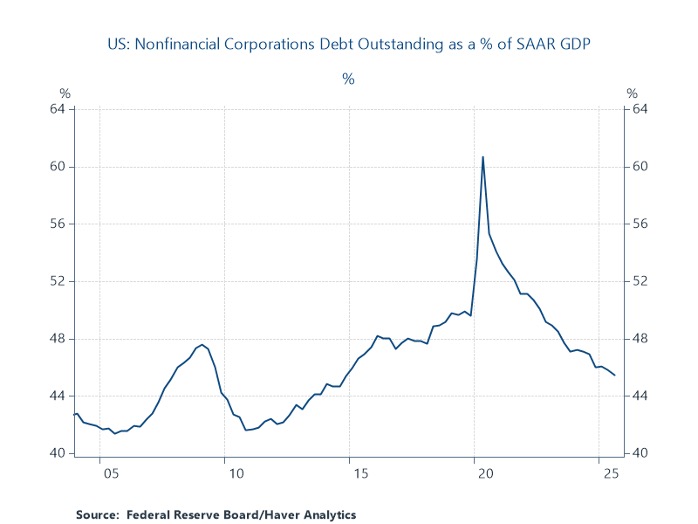
The most recent Federal Reserve reports on commercial bank balance sheets and household debt along with the FDIC Report show that household and business debt levels are not high relative to economic activity and disposable personal income, and banks remain healthy and well-positioned. Chart 1 shows total household debt including mortgages as relatively low as a share of disposable income while Chart 2 shows that business debt is falling as a share of GDP. Chart 3 shows the shares of consumer loans by type: excluding the policy-induced spike in student loan delinquencies, the only concern is credit card debt where seriously-delinquencies are uncomfortably high. Chart 4 shows delinquencies of business loans: delinquencies of commercial real estate loans have risen only modestly since the Covid-related spike in commercial real estate vacancies in big cities and remain below delinquencies of residential real estate loans. Recent indicators suggest that the problems in commercial real estate are now diminishing.
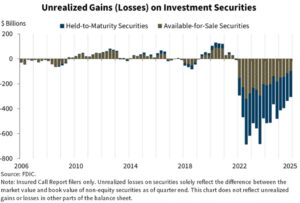
Charts 5-7 are from the recent FDIC Report: they show that banks' past-due loans and leases and charge-offs are relatively low; their reserve coverage ratio is relatively high; and their unrealized capital losses of investment securities is shrinking (banks have reduced the duration of their securities and longer-term yields have declined). The FDIC tabulation of problem banks is low. All-in-all, commercial banks are in relatively good shape.
The private credit market remains murky, except for those who are directly involved — the lenders and their sources of capital and leverage--and have access to the financials of the credits they are involved in. The lower costs and higher efficiencies of private lending that stems from lower costs of supervision and government regulatory oversight has a downside: lack of knowledge of data and transparency. In a recent study by the Alternative Credit Council and Houlihan Lukey, Financing the Economy 2025, the private credit market is described in broad terms and includes many interviews with active private creditors, but it does not include the sufficient data to analyze and evaluate private credit. (In a recent article I co-authored with Amit Seru, “The Fed Needs to Earn Its Independence. Just Setting Rates Isn’t Enough,” we argued that the Federal Reserve should seek to obtain information on the credit activities of the private lenders.)
It's important to distinguish between the different kinds and structures of private credit. Some (many?) private creditors are basically making the loans that commercial banks used to make, benefiting from the lower costs of supervision, compliance and regulation. They raise private capital, leverage it with loans from commercial banks, and provide credit to borrowers at healthy spreads. They conduct credit analyses of their clients. Presumably, the credit quality of their loans does not deviate significantly from the commercial and industrial (C&I) loans of commercial banks, although that is not ensured. Also, it is likely that most private creditors are less leveraged than banks.
Two of the largest concerns with private credit are 1) that the proliferation of private lending may be diluting the quality of the private creditors and lessening their credit standards and oversight of the loans, and 2) some private lenders have a narrow focus of their lending activities, and their lack of sufficient diversification may generate concentrations of defaults.
Currently, there's a ton of news on the rising debt used in the AI infrastructure buildout, including data centers and energy production facilities. Sorting out the corporate finances of the companies leading the AI capital spending buildout is difficult. For many companies involved in the AI buildout, much of the capital spending on data centers and energy related buildouts has been financed with internal capital and cash flows. More recently, however, a significant amount has been financed by debt. At the same time, the revenues and free cash flows generated by AI-related products are accelerating dramatically. Based on standard business metrics, a snapshot of the finances of many of the largest AI firms are reasonable or even good. Several may be problematic.
The pace of implementation of AI into commerce and society is stunning. Most likely it will add materially to productivity, economic growth and profits, and will disrupt labor markets. As with all other innovations in U.S. history, disruptions will result in some jobs lost and other new jobs created. I take a positive view of longer-run outcomes. In weighing current commentary on the labor market outcomes stemming from AI innovations, be careful in extrapolating anecdotal evidence to the entire economy, and remember the adage “bad news sells.”
As with all episodes of technological innovation in the U.S., there will be some failures among the AI innovators, and some of the providers of capital and credit will incur losses. However, in contrast to the GFC, the losses will be incurred by a narrow group of capital and credit providers and will not be pervasive and unhinge society and commercial banking. Consider an insurance company or a state pension that finances an AI project and incurs a sizable loan default or capital loss. The jarring impacts of the losses will be narrowly focused and would be relatively minor to the broader commercial banking industry. Similarly, the impacts of the large losses stemming from the Covid-initiated collapse of commercial real estate in big cities were relatively narrow and didn’t unhinge the banking industry. The private credit industry and AI require scrutiny. A close assessment of individual company products, revenues and profits and capital spending is required. This may be a time to be cautious in private lending. But starting with the premise that we should be fearful because it has parallels to the pre-GFC period is not particularly instructive.
Chart 1. Household Debt Outstanding/Disposable Personal Income
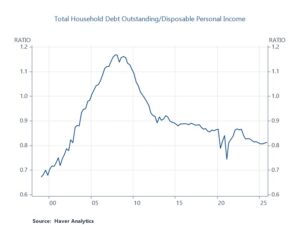
Chart 2. Non-financial Corporate Debt/GDP
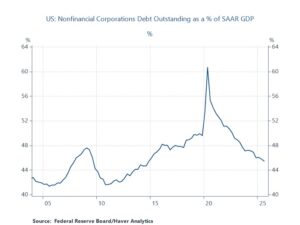
Chart 3. Seriously Delinquent Consumer Loans and Mortgages
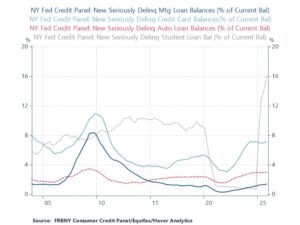
Chart 4. Delinquencies of Business Loans
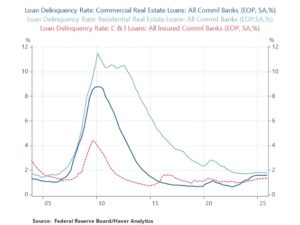
Chart 5. Past-Due and Charge-Off Rate
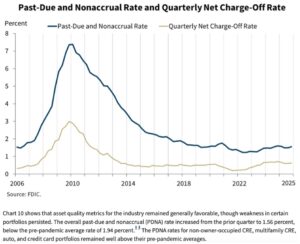
Chart 6. Bank Reserve Coverage Ratio
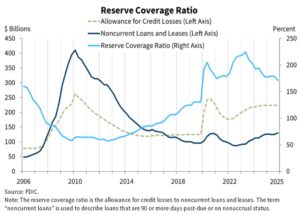
Chart 7. Unrealized Losses on Bank Investment Securities
Keep an Eye on Real Wages and Hours Worked in Economy
U.S. economic growth has remained solid through most of 2025, driven by healthy gains in consumption and strong business fixed investment, particularly for the buildout of AI. This has defied the pessimists’ worries about President Trump’s misguided tariffs, clampdown on immigration and cuts in research grants to universities. The only real laggard in 2025 was the housing sector, which suffered from continuous declines in spending on construction and improvements. But that was last year and we should not expect any let up in erratic tariff policies and anti-immigrant initiatives in 2026.
Despite these obstacles, the outlook for sustained expansion in 2026 looks favorable, and the probability for recession is low. Current conditions are inconsistent with onsets of recession in the past. Consider the following two items that will support aggregate demand: 1) three Fed interest rate cuts in September-December 2025 lowered the real Fed funds rate below the Fed’s estimate of the longer-run real rate of interest consistent with its dual mandate of 2% inflation and maximum employment, and the Federal Reserve Bank of Chicago’s Financial Conditions Index signals loose financial conditions, and 2) fiscal policy is stimulative, as the OBBBA of 2025 extended the 2017 tax cuts and added some additional cuts (eliminating tax on income from tips, expensing of outlays for research and development) that will boost tax refunds in Spring 2026 by approximately 0.6% of disposable personal income. In this environment, 3) business inventories are relatively low and 4) employment is well-aligned with output (GDP). Accordingly, any slump in aggregate demand will not force businesses to cut output and/or employment in a meaningful way.
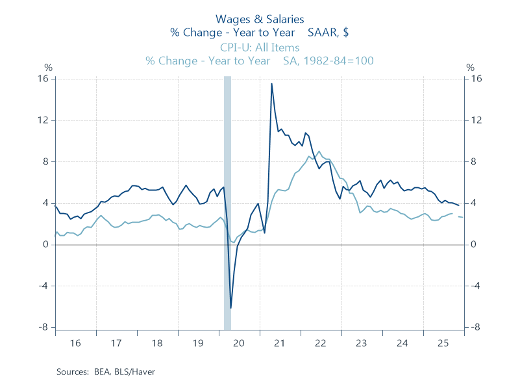
Labor market and personal income dynamics. One key trend to keep an eye on is real wage and salary incomes, a key indicator of labor market conditions and measure of consumer purchasing power. Growth in personal income from wages and salaries has decelerated to 3.8% in the year ending November 2025 (Chart 1). That’s down from a 5.5% rise in the prior year. At the same time, CPI inflation was 2.7% in the last two years ending November 2025. According, the year-over-year growth in real personal disposable income from wage and salaries has receded to 1.1% in the year ending November 2025, significantly slower than its 2.8% rise in the prior year.
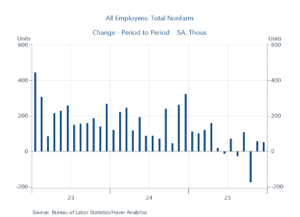
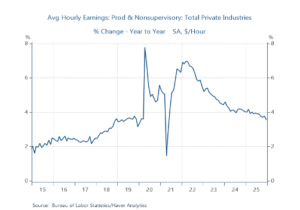
This deceleration in real wages and salaries reflects primarily a combination of moderating gains in average hourly earnings (AHE) and weakness in employment. As shown in Chart 2, AHE have moderated to 3.5% year-over-year growth from 4.1% a year earlier. The yr/yr rise in AHE will decline further in the January and February 2026 readings as the high monthly increases in Jan-Feb 2025 roll off. At the same time, establishment payroll gains have flattened significantly. In the six months July-December 2025, employment rose a net 87,000, an average of 14k per month; in the prior six months jobs rose 497k, an average monthly rise of 82k (Chart 3). In the prior year ending December 2024, employment rose over 2 million.
Chart 1. Wages and Salaries and CPI Inflation
Chart 2. Average Hourly Earnings
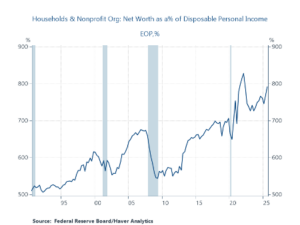
Chart 3. Establishment Payrolls
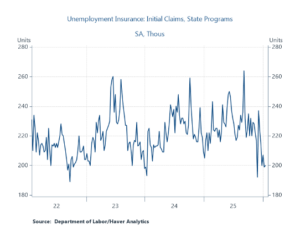
The flatter employment gains and weakening of labor markets is a product of less supply of labor and weaker demand. Trump’s clampdown on immigration has clearly constrained the supply of labor. It has probably also dampened business demand for labor, particularly in construction and leisure and hospitality sectors. Businesses have responded by slowing hiring while the high costs of search and hiring have reduced their layoffs. Initial unemployment claims have remained low (Chart 4).
Chart 4. Initial Unemployment Claims
Amid slower gains in employment and average hourly earnings, the positive in labor markets is aggregate hours worked increased 0.7% in 2025. That’s fortunate insofar as wages and salaries and disposable personal income are driven by hours worked, not employment. Importantly, stronger productivity gains have powered the solid economic growth. During the year ending 2025Q3, productivity (private output/aggregate hours worked) in the nonfarm business sector rose 1.9% and 2.3% in the manufacturing sectors. This decided pickup in productivity reflects the continued momentum in business investment in data storage and related AI infrastructure plus production efficiencies stemming from broadening uses of AI innovations in both manufacturing and service-producing industries.
The wealth effect and rate of personal saving. Most households spend most of what they earn, so consumption will be driven largely by growth in disposable income. In addition, the ongoing surge in household net worth, reflecting the rise in equity valuations and real estate, has lifted the propensity to spend. In the last year, household net worth has risen 7.6% to an all-time high of $181 trillion. To put it into perspective, household net worth has risen to 7.9 times the annual flow of disposable personal income (Chart 5). The sharp increases in household net worth are adding to the flow of disposable income (through required minimum withdrawals of IRAs and private pensions and gifting and the like) and boosting consumption through the positive wealth effect--increasing the propensity to spend out of disposable income. As a result of the sizable wealth effect, the rate of personal saving declined to 3.5% at its last reading in November 2025. It cannot be expected to fall much further.
Chart 5. Household Net Worth/Disposable Personal Income
Add it all up, and consumer purchasing power, driven by employment, hours worked and average hourly earnings, are key variables to follow in 2026. The highest probability outlook is continued expansion at a slower pace of growth.
Mickey D. Levy is a Visiting Fellow at the Hoover Institution at Stanford University and a longstanding member of the Shadow Open Market Committee

Monetary Policy Responses to Shocks
Here's a paper and presentation that I co-authored with Dr. Michael Bordo and presented at the November 2025 Shadow Open Market Committee meeting. "Monetary Policy Responses to Shocks" analyzes the history of shocks — the Great Inflation of 1965-1982, the Great Financial Crisis and Covid, plus an array of minor disturbances — and how the Fed responds to them. We find that the Fed has responded unsystematically, and often in ways that extend and accentuate the costs imposed by the original shock.
Paper: Monetary Policy Responses to Shocks (Michael D. Bordo and Mickey D. Levy, Nov. 7, 2025, Shadow Open Market Committee)
Power Point: Monetary Policy Responses to Shocks (Michael D. Bordo and Mickey D. Levy, Nov. 7, 2025, Shadow Open Market Committee)
The SOMC meeting, the first in its partnership with the Center for Financial Stability, included great presentations on Fed independence, Fannie and Freddie, and financial stresses.

Reflections on Jay Powell’s Jackson Hole Speech
Jay Powell’s Jackson Hole speech covered two topics: a review of current economic and inflation conditions and the stance of monetary policy, and an outline of the Fed’s new Strategic Plan and how it has been revised from its 2020 Strategic Plan. In summary, Powell’s assessment of current conditions tilted toward expressing more concern about labor market weakness than above-2% inflation, fueling expectations of Fed easing, while the Fed’s revised Strategic Plan eliminated some of the key asymmetries in its 2020 Strategic Plan that favored higher inflation and prioritized maximum employment, reverting more closely to its balanced 2012 Consensus statement.
The Fed’s economic review and policy stance. Powell’s assessment of the economy is that tariffs, immigration policies and related uncertainties have weighed on performance and slowed growth and weakened labor markets, and that inflation has remained elevated, and the impact of tariffs on consumer prices has become more visible. He stated that while inflation has remained above the Fed’s 2% target for 4 years, both survey and market-based measures of inflationary expectations have remained anchored to the Fed’s 2% long-run inflation target. He concluded that “…with policy in restrictive territory, the baseline outlook and the shifting balance of risks may warrant adjusting our policy stance”.
While carefully crafted, his statement suggests that the Fed is accepting of inflation modestly above its 2% target because it views current monetary policy as restrictive, which will weaken economic growth and eventually lower inflation, and the Fed is concerned about weakening labor markets. The Fed’s perception that monetary policy is restrictive is based on its observation that the real (inflation-adjusted) Fed funds rate target (4.25%-4.5%) is comfortably above the FOMC members’ estimate (in the Fed’s June 2025 Summary of Economic Projections) that the longer-run r* (the natural real rate of interest consistent with the economy growing along its potential path and the Fed’s 2% inflation target) is 1%. My view is r* is higher, which suggests that monetary policy is not as restrictive as the Fed perceives.
Financial markets picked up this tilt, as Treasury bond yields fell, the stock market rose and the US dollar fell.
The Fed’s revised Strategic Plan. Based on its obsession with the Effective Lower Bound, driven by its worries about too-low inflation and risks of a collapse in inflationary expectations combined with its view of a persistently low real interest rates, the Fed’s 2020 Strategic Plan introduced asymmetries into its 2012 Consensus Statement, advocating above-2% inflation for an undefined period of time as a “makeup strategy” following a period of below-2% inflation (through its “Flexible Average Inflation Targeting”; there was no make up strategy following an above-2% period of inflation), prioritizing its employment mandate (by replacing the word “deviations” with “shortfalls” from maximum employment), and effectively eschewing preemptive monetary tightening when full employment anticipated higher inflation.
The newly revised 2025 Strategic Plan reverses those asymmetries: it “removed language indicating that the ELB was a defining feature of the economic landscape”, removed the “makeup strategy” favoring higher inflation following periods of below-2% inflation, re-emphasized that “price stability is essential for a sound and stable economy and supports the well-being of all Americans”, dropped the use of “shortfalls” from maximum employment, and in a back-handed way reinstituted pre-emptive monetary tightening (“In particular, the use of ‘shortfalls’ was not intended as a commitment to permanently forswear preemption or to ignore labor market tightness”). The Fed also stated that “consistent with the removal of ‘shortfalls’, we made changes to clarify our approach in periods when our employment and inflation objectives are not complementary”.
While Powell avoided directly criticizing the 2020 Strategic Plan, the Fed’s explicit reversal of the asymmetries that the 2020 Plan had introduced was clear. Powell stated “In approaching this year’s review, a key objective has been to make sure that our framework is suitable across a broad range of economic conditions.” Of course, that’s a key characteristic of a robust strategy. In reality, the 2002 Strategic Plan was more of a tactical plan that allowed the Fed to overheat the economy and allow higher inflation because of its overstated fears of too-low inflation and the ELB. Powell concluded his remarks by emphasizing that the newly revised Strategic Plan is consistent with the Congressional mandate of price stability and maximum employment.
A note in remembrance of Charlie Plosser. When Charlie was President of the Federal Reserve Bank of Philadelphia, with the urging and 100% support of Fed Chair Ben Bernanke, Charlie was a key architect of the Fed’s original Strategic Plan in 2012 that established its dual mandate of a 2% inflation target and maximum employment, while noting that a numeric target for employment was inappropriate because labor markets are affected by many non-monetary factors that are beyond the control of the Fed’s monetary policy. Charlie always emphasized the benefits of the symmetry of the Consensus Statement’s dual mandate and how it was robust under different circumstances, was easy to understand and facilitated clear communications. Immediately following Jay Powell’s roll out of the Fed’s 2020 Strategic Plan in his Jackson Hole speech in August 2020, Charlie and I teamed up and wrote a critique that identified all of the flaws and asymmetries of the Fed’s new Strategic Plan and concluded that it would only be a matter of time before its flaws would be revealed (The Murky Future of Monetary Policy, October 1, 2020, Hoover Institution Working Paper). Subsequently, inflation soared and the Fed sat on its hands and delayed normalizing monetary policy. This will always be viewed as a major policy blunder, despite the Fed’s efforts to the contrary. Since then, Charlie and I teamed up and wrote several updated papers recommending changes in the Fed’s Strategy. The latest was published by the Wall Street Journal less than a month ago (“What the Federal Reserve Can Do to Help Itself,” July 24, 2025). Charlie passed away last week. I wish he was still around to see how the Fed’s newly revised statement in many ways reverted back to the 2012 Consensus Statement that he was so instrumental in crafting. We would be having a very lively conversation.


Macro Minds With Kallum Pickering


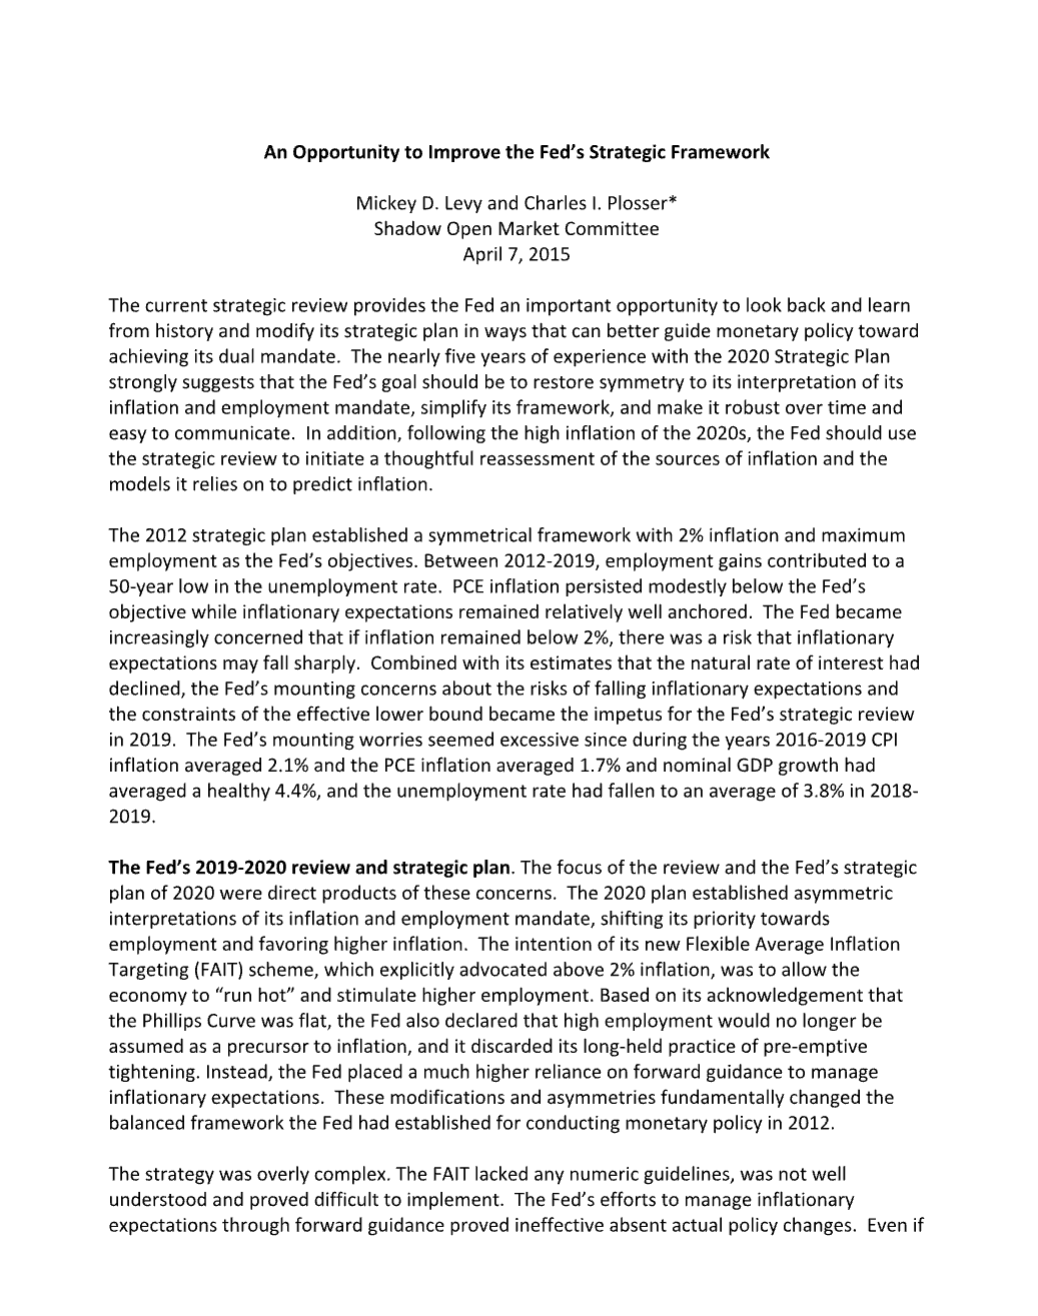
An Opportunity to Improve the Fed’s Strategic Framework
Yesterday, the Shadow Open Market Committee’s meeting in Washington, D.C. addressed issues of how the Fed may improve its policy framework.


China’s Stimulus Boosts Markets, but Expected Economic Impact Modest
China’s latest aggressive stimulus package has provided hope to financial markets, generating a stock market surge that partially retraces its sustained decline since early 2021, but it is unlikely to turn around China’s disappointing economy. China’s economic growth has been far weaker than its official GDP statistics suggest, as consumption and domestic demand have struggled following the predictable collapse in real estate. China’s economy is expected to continue to struggle. In reports in recent years, I have described the transition of China’s economic structure and its government-generated excesses in real estate, and warned that its adjustments would dampen its economy for years to come. Everything is unfolding as predicted.
The negative wealth effect on consumption is most likely to persist for several more years, as households must save more and spend less to replenish their balance sheets that were hammered by the collapse in housing. Loss of household and business confidence is weighing on economic activity. At the same time, China’s export-related manufacturing sectors are under pressure. Outside of strong demand for EVs and some manufactured goods, overall global demand for China’s goods has diminished and foreign nations and companies have reduced their supply chain exposure to China. China’s exports have been relatively flat in the last two years. Its sizable increase in exports to Russia has been largely offset by lower exports to western nations. Imports have also been relatively flat, reflecting the weaker consumption and domestic demand. These trends in export-related manufacturing sectors have dented employment and wages.
China remains an economic powerhouse and is the second biggest economy in the world and still the largest global hub of manufacturing and trade. However, its longer-run economic prospects will remain decidedly downbeat as long as President Xi’s authoritarian rule persists and clamps down on free enterprise. Such central-control economic systems are prone to misallocating national resources, posing barriers to capital flows and constraining advances in productivity.
China’s boom.
From the 1990s through roughly 2015, economic growth boomed as Chinese leadership allowed U.S. free enterprise alongside its centrally controlled economy. Huge inflows of foreign capital (financial, physical, and human) helped to ramp up the productive output and productivity of China’s enormous pool of low-cost labor to become the world leader in export-related manufacturing. Revenues from exports were wisely allocated into building productivity-enhancing modern infrastructure. Living standards and society advanced dramatically. China grew from a poor third world country to become the driver of global growth and trade, and the world’s second biggest economy. With its successes came higher wages and sharply rising costs of production. This generated a gradually slowing of potential growth, a natural phenomenon among advancing nations.
The shift in economic regime.
President Xi assumed leadership in 2012 (first as Prime Minister), and quickly reverted to his Chinese socialist roots and began clamping down on free enterprise. Economic historians who look back on this major inflection point in China’s modern history debate whether Xi believed the robust growth would continue under his socialist regime, or whether he was willing to trade growth for central control and power. My assessment is he presumed that China’s strong growth would persist and the imposition of his socialist ideals would generate favorable economic performance. His poor assessment failed to learn from the histories of centrally controlled economic regimes.
Excessively high GDP growth targets.
China’s slowdown in potential growth, a natural consequence of China’s economy growing toward its productive capacity and operating costs rising relative to global levels, was accentuated by the gradual tightening controls of capital flows, production, regulations on global joint ventures, and increased allocations of capital into state-owned enterprises (SOEs). Of note, the government began clamping down on the large and highly innovative and productive social media companies because their platforms had become a threat to the government — they facilitated free thinking and communications that was antithetical with Chinese socialist ideals, and their size and influences had become a threat to the Chinese government. This adversely affected foreign capital inflows and joint ventures with foreign companies, and the exchange of knowhow and technology. Foreigners had become tired and wary of China’s unsavory business and trade practices which accentuated these trends.
China’s central planners targeted GDP growth too high and generated real estate excesses in their efforts to achieve them. As potential growth moderated, Beijing established unrealistically high GDP targets. Achieving them proved to be a classical error that led to the misallocations of resources and was the source of its excesses in real estate. Their widely announced plan (beginning in 2015) to transition from reliance on exports to domestic consumption and services didn’t unfold, and growth began to fall short of GDP targets. The government filled the gap and met the GDP targets by ramping up investment spending. Some of the investment was for infrastructure but a sizable portion involved investing heavily in real estate. Local governments, which play a heavy role in China’s fiscal policies, achieved their contributions to the GDP targets given to them by Beijing by selling land to property developers, providing significant leverage (directly and through Local Government Financing Vehicles, LGFVs) and direct investment. Real estate and economic activity flourished year-after-year. Under the surface of the high GDP growth, the misallocations of national resources and excesses in housing and debt created excesses in debt. (The LGFVs were revealed as effective shells for hiding the mounting government debt).
The real estate boom greatly lifted economic activity and wealth. Global observers (including Wall Street economists) marveled and took for granted China’s ability to achieve such high sustained GDP growth. But they failed to look under the surface and scrutinize the mounting misallocation of resources and what they would lead to. China’s investment remained in excess of 40% of GDP year-after-year, nearly double other nations, while domestic consumption remained soft. China’s National Bureau of Statistics (NBS) does not disaggregate the investment data and show separately government and private investment, but it’s clear that most of the excessive investment spending was in real estate that provided low (negative) rates of return.
Everything worked well as long as expectations of home prices remained positive, which supported more demand for housing and debt. People and businesses like it when the value of their real estate goes up, and it increases their propensity to spend. But the mounting excesses in the supply of housing relative to demand, and growing debt and debt service costs of China’s land developers and local governments finally led to a shift in expectations. Skeptical citizens stopped buying new (and partially built) homes. A sharp decline in housing demand accentuated the dramatic excesses in supply and generated a collapse in real estate finances. China’s reversal and subsequent adjustments to the excesses in real estate have had many similarities to the bursting of Japan’s bubble in housing and asset prices in the late 1980s and the U.S.’s adjustments following its debt-financed housing bubble of the early 2000s.
Real estate had become a key driver of China’s economy. Some estimates put real estate activity at its peak over 25% of GDP and as much as 75% of household net worth, multiples higher than in the U.S. and other advanced nations (Rogoff and Yang, “Rethinking China’s Growth”, 2023). When the real estate sector collapsed, it undercut two vital factors that had been driving the economy: 1) consumer finances and spending and 2) local government finances, which had relied heavily on revenues from land sales to developers.
The negative wealth effect.
The large hit to household net worth has lowered the propensity to spend, as households must save more to replenish their balance sheets. This further delays the plans and hopes of China’s leaders for a transition in the economy from exports to consumption. Ongoing declines of real estate values and clear evidence of the excesses — Chinese citizens now see half built and empty apartment complexes rather than building cranes and the read about government bailouts of the bankrupt land developers — reinforce negative expectations of home prices and reduce demand for housing. This will elongate the negative impact on consumption.
The experiences in Japan and the U.S. following their housing and asset price bubbles suggest that the negative wealth effect will constrain China’s consumption for several more years. Japan’s 75% decline in housing values and the Nikkei following their late-1980s boom (that was generated by the BoJ’s efforts to pump up the economy) led to the “lost decade of the 1990s” of soft growth marked with several recessions and on-and-off mild deflation. Of note, however, Japan’s government and Bank of Japan were very slow to address the problems and insolvencies of large Japanese banks, and finally recapitalized the largest banks and insurance companies in 1997. The BoJ’s policy interest rate was reduced from 6% in 1990 to 0% in the late 1990s. The recapitalization was financed by government issuance of bonds that involved soaring debt. It took 34 years for the Nikkei to regain its December 1989 high.
The negative wealth effect in the U.S. that resulted from the collapse of the debt-financed housing bubble of the early 2000s — during the financial crisis, household net worth fell sharply, reflecting the 40%+ declines in both home prices and the S&P500 — contributed to the slow recovery of consumption and the economy, despite the Fed’s zero interest rates and quantitative easing that suppressed bond yields, and the 2009 fiscal stimulus. Despite these stimulative efforts along with private banks writing off nearly all home equity loans, the damage to the economy resonated for years. Real GDP regained its earlier 2007Q4 peak in 2011Q3 and new and existing home sales still remain well below their 2006 peaks. The Case Shiller Home Price Index that peaked in late 2007 through early 2012 and finally regained its prior peak in late 2016.
Government finances.
The sharp curtailment of new construction has reduced local government land sales to developers and undercut a major source of revenues. This has revealed the fragile local government finances and their high indebtedness and undercapitalization of LGFVs. This has constrained the central government’s capacity to stimulate the economy. Lacking demand, there has been a collapse in sales of land to developers. The fall in housing construction has been a negative for government finances, economic activity and jobs. Beijing has rolled out a series of modest stimulus packages, hoping they would stabilize housing and buoy the consumer. However, they have been insufficient to stabilize the decline in real estate values and activity and offset the negative wealth effect. The government faces a sizable challenge: estimates of empty and partially build apartments in China are around 90 million units. That’s a staggering imbalance that will take years (and probably much more government deficit spending and debt) to work down to manageable levels.
With the current sizable stimulus package, the national government has signaled that will incur large deficits and borrow heavily to support housing, reduce the costs of consumer debt and provide financing support to local governments.
The impact of the stimulus.
The package has provided a big boost to China’s financial markets, with stocks up sizably. Whether the announcement proves to be a credible “Draghi moment” — “whatever it takes” Euro rescue moment — remains uncertain, reflecting the unreliability and unpredictability of China’s leaders. But its magnitude is decidedly insufficient to materially reduce the enormous overhang of excess supply of housing or generate a sustained increase in consumer spending. While it provides financial incentive to purchase homes, housing excesses in supply will remain, as will expectations that home prices will fall further. The stimulus package does ease some debt service burdens, but most household balance sheets remain dominated by real estate and will continue to suffer from the earlier declines in household net worth. Accordingly, the need to save will remain high, squeezing consumer spending.
The Peoples Bank of China’s lower interest rates and cuts in bank reserve requirements (by 50 basis points) will ease the debt-service costs of existing homeowners and have some marginal positive impact on lending. However, demand for loans is weak. The PBoC is also reducing the borrowing costs for existing mortgage holders and lowering the minimum down-payment on new home purchases to 15% from 25%. These will modestly reduce the debt service costs on current homeowners and encourage new home purchases. But this will not materially narrow the supply-demand imbalance in housing. The PBoC will cover 100% of the loans for local governments to buy unsold homes with cheap funding. Effectively, the central bank will make cheap loans to local governments to buy unsold homes and take them off the market. This “warehousing” of unsold homes only shifts the holdings of the excess supplies and postpones the necessary adjustments.
This stimulus package acknowledges China’s languishing economy and reflects the willingness of the government to deficit spend more and incur rising debt to resolve the problem, but the excesses the government created will continue to weigh heavily on consumption and domestic demand.

A Comparison of the Biden and Trump Economic Platforms
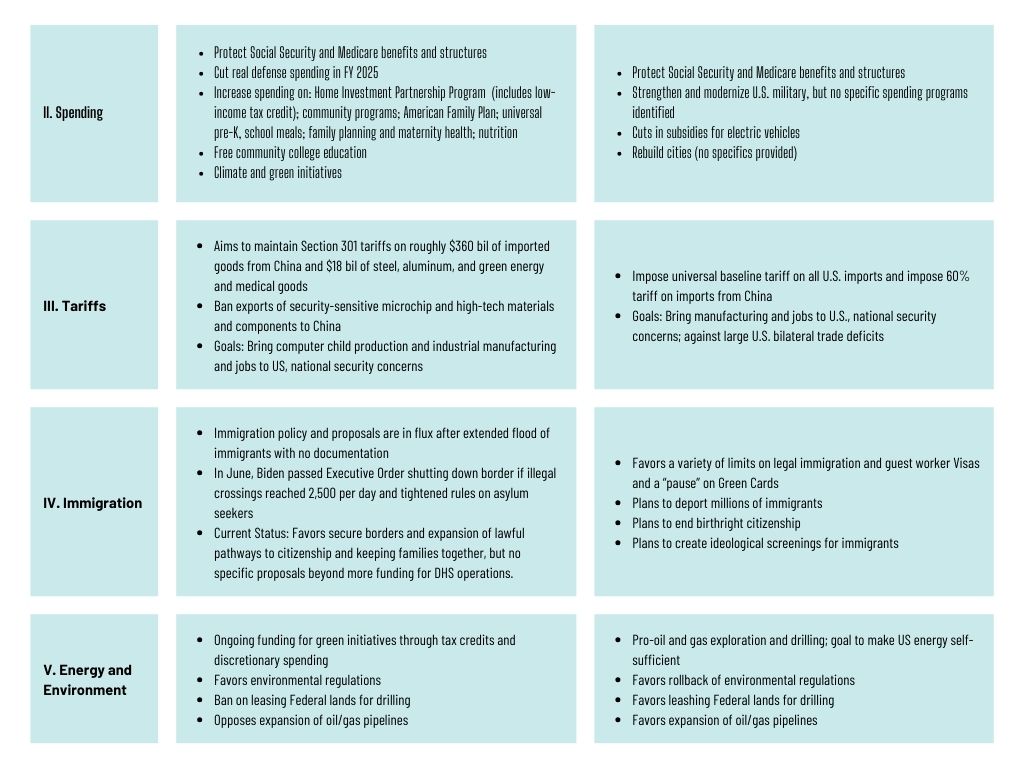
This brief provides a side-by-side comparison of the economic platforms of President Biden and former President Trump. It considers policy proposals on taxes and spending, tariffs, regulations, immigration, climate, energy, and considers treatment of the Federal Reserve. The proposals are sourced from the official campaign websites and other official documents and statements of the candidates. It does not consider the economic effects of the two candidates’ proposals and does not address the personal characteristics of the candidates. Since 1992, I have prepared side-by-side comparisons of presidential candidates. More so than in many previous elections, Biden’s and Trump’s stances on select economic policies are not well defined.
Differences and a Few Similarities Between the Two Candidates’ Proposals
On key issues of taxes, spending, and the policies for business, energy, and the environment, the two candidates’ economic platforms present stark alternatives. President Biden’s economic platform is decidedly in the tradition of the Democratic Party, with proposals to increase spending and increase taxes for higher income and wealthier taxpayers, and anti-business provisions. Former President Trump’s proposals are more in the Republican Party mold of lower taxes and restrained spending and are generally more favorable toward business and energy production and negative on green and environmental issues. However, on issues like tariffs, immigration, and regulations, Trump’s platform is less in line with free enterprise Republican traditions. Rather, he pushes systems of central control.
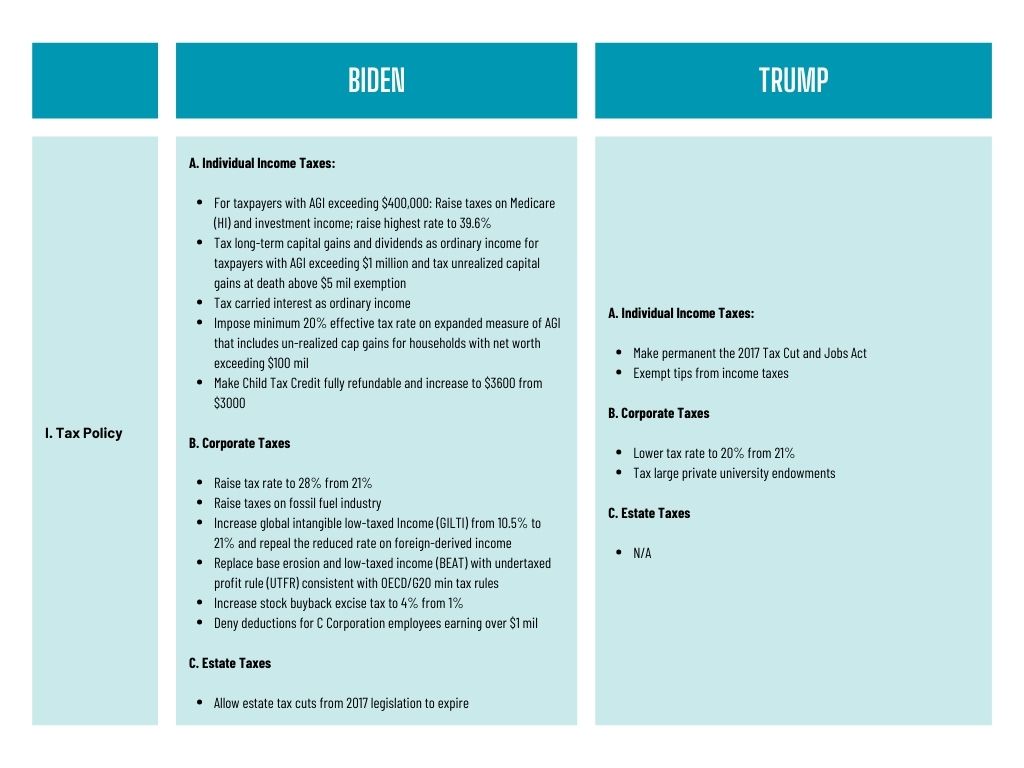
On taxes, Biden proposes sizable tax increases for higher income taxpayers, including higher tax rates and taxes on interest and dividend income and unrealized capital gains of the wealthy, and tax subsidies (credits) for lower income households. Trump proposes to make the 2017 Tax Cuts and Jobs Act, which is set to expire in 2025, permanent, while Biden would allow most provisions of the Act to expire. Trump proposes modest reductions in the corporate tax rate, while Biden proposes increases in corporate taxes and minimum effective taxes on income from overseas and corporate tax rules consistent with OECD and G20 minimums.
On spending, both candidates explicitly state they would maintain the current structures and spending on Social Security and Medicare. Biden proposes a wide array of spending increases on social issues, while Trump has alluded to cutting spending on social issues but doesn’t specify any cuts. Biden proposes cuts in real defense spending in his Fiscal Year 2025 budget proposal, while Trump states the objectives of strengthening and modernizing defense but doesn’t provide any specific proposals or weigh in on defense spending implications.
Both Biden and Trump propose higher tariffs, with similar objectives, particularly on imports from China, although Trump’s proposals are more aggressive, based on his aversion to bilateral trade deficits with other nations.
On immigration, Trump proposes sharp cuts in immigration and has stated that he endorses the deportation of millions of undocumented immigrants, and a temporary “pausing” of Green Card grants for legal immigrants. Currently, the Biden platform is in flux, with new limitations imposed last month on immigrants.
Biden’s platform includes its recent climate and green agenda accomplished through regulations and tax credit subsidies and regulations that limit drilling. Trump is pro-fossil fuels and gas exploration, and anti-green and climate initiatives, but his platform does not provide specific proposals that would accomplish these objectives.
Both candidates say they will lower inflation. Biden proposes caps on select prices of pharmaceuticals and administrative efforts to lower corporate prices and fees. Trump does not provide specific proposals.
Regarding the Federal Reserve, both candidates favor low interest rate policies, but neither candidate’s platform includes any proposal that would affect the Fed’s conduct of monetary policy. Jerome Powell’s tenure as Fed Chair expires in Spring 2026, and the president will nominate Powell’s successor and any other Fed governors when the positions open. Biden’s short list for Fed Chair apparently includes noted doves Austen Goolsbee and Lael Brainard. Trump has been an outspoken critic of the Fed and his advisors have discussed the idea of blunting the independence of the Fed. It is highly uncertain how this would be accomplished.
Discussion of the Comparison
Several observations about the candidates’ economic platforms are important.
First, both President Biden’s and former President Trump’s platforms basically ignore the current and projected persistent budget deficits and mounting government debt. Both candidates are explicit in supporting the current Social Security and Medicare programs, two of the largest sources of mounting deficit spending and debt projections, while Biden proposes ongoing increases in spending and Trump recommends tax cuts. Based on the two platforms, neither candidate has the appetite for proposing meaningful deficit cutting legislation, so the prospects for meaningful reductions in projected deficits and debt seem slim.
Second, Congressional outcomes will have a large impact on the achieved economic policies of the next president. A Biden victory and Democratic control of both the House and Senate would likely result in sizable spending and tax increases, potentially including a “wealth tax.” A Trump victory and Republican sweep of Congress could potentially lead to jarring spending cuts and shifts in trade, immigration, and regulatory policies well outside of current expectations. Split powers presumably would mitigate against sharp shifts in economic policies that Congress can control.
Third, as presidents, both candidates have made extensive use of Executive Orders and regulations to implement desired policies on a wide array of issues, including international trade, labor, motor vehicles, corporate structure and mergers, and more. Both have used such executive powers to reinterpret rules and laws to achieve desired outcomes, and both have used Executive Orders and regulations to avoid Congressional debate and voting. A split in political powers — either between the executive branch and Congress, or between the House and the Senate — would likely lead to even more extensive use of such executive powers.
Fourth, recent history shows that while some presidents have successfully pursued the economic platforms spelled out during their election campaigns, others have not. Those that did: President Reagan (1980-1988), whose campaign emphasized pro-economic growth policies including tax cuts and a defense spending buildup; President Obama (2008-2016), who campaigned on economic redistribution (spending increases on social issues and higher taxes on high income taxpayers) and receding U.S. foreign influences. Those that didn’t: President Bush (1988-1992) who raised taxes after campaigning against them (read my lips: no new taxes); President Clinton (1992-2000), who supported NAFTA and welfare reform after campaigning strongly against them; and President George W. Bush, who passed significant spending increases, and following 9/11, led the U.S. to become the world’s policeman, after campaigning as a fiscal conservative and international isolationist. As presidents, both Trump and Biden pursued the major themes of their economic platforms when they were in office. Trump’s economic platform in 2016 focused on tax cuts and high tariffs, and anti-China policies; and President Biden’s 2020 campaign emphasized more spending for social issues and green initiatives and higher taxes on high income taxpayers and redistribution and pro-labor initiatives. It’s impossible to know what the next administration will bring, but based on precedent, we can anticipate that these two candidates will attempt to pursue their platforms if they are elected.
Biden-Trump Platform Comparison Summary

Japan’s Economy, the Yen, and the Bank of Japan
Thesis: The Bank of Japan’s policy of zero interest rates and ongoing asset purchases is contributing to a weak yen and harming Japan's economy. Raising the BoJ’s policy rate toward its 2% target would contribute to an appreciation of the yen and boost the consumer and the economy. The BoJ’s policy rate has been zero or slightly negative for years and its massive asset purchases continue to balloon its balance sheet. This has served to distort financial markets but has not stimulated economic activity. The BoJ’s policy rate is now more than 2 percentage points below inflation. In other advanced nations, a rise in the central bank policy rate involves tighter monetary policy that weakens domestic demand. In Japan, following many years of zero or negative rates and asset purchases, normalizing monetary policy would enhance economic performance.
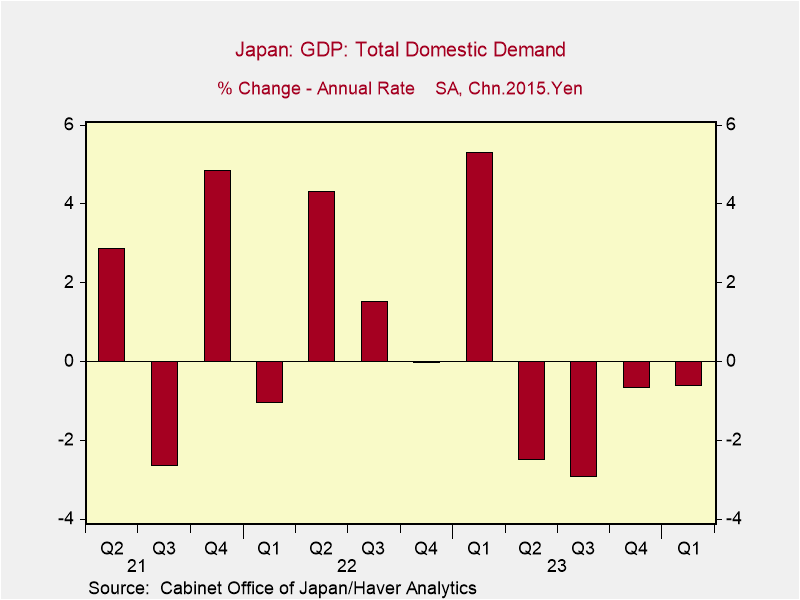
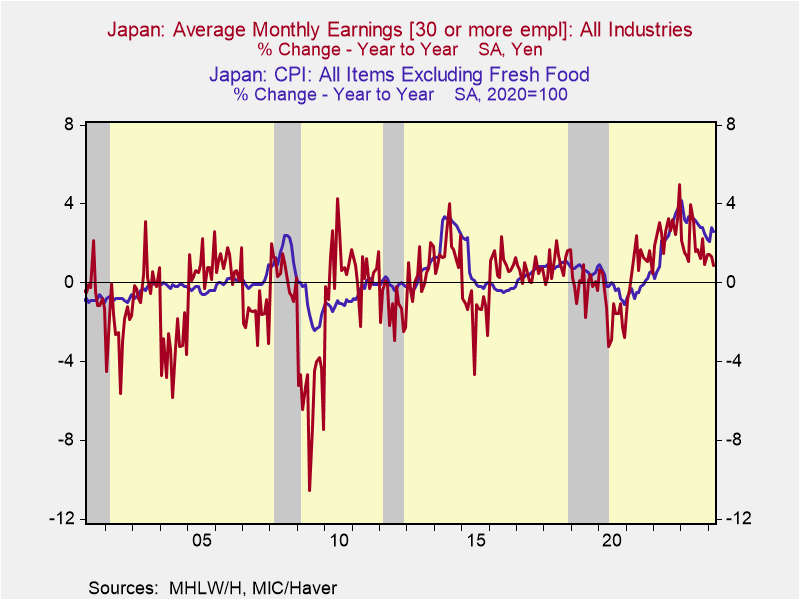
Japan's economy has struggled in the last year. Private consumption and gross business capital formation have each fallen in the last four consecutive quarters, reducing domestic demand (Chart 1). 2024Q1 was notably weak, with a 2% annualized decline in real GDP. Earnings have fallen behind inflation, cutting into purchasing power (Chart 2).
Chart 1. Japan Domestic Demand Chart 2. Earnings and Inflation
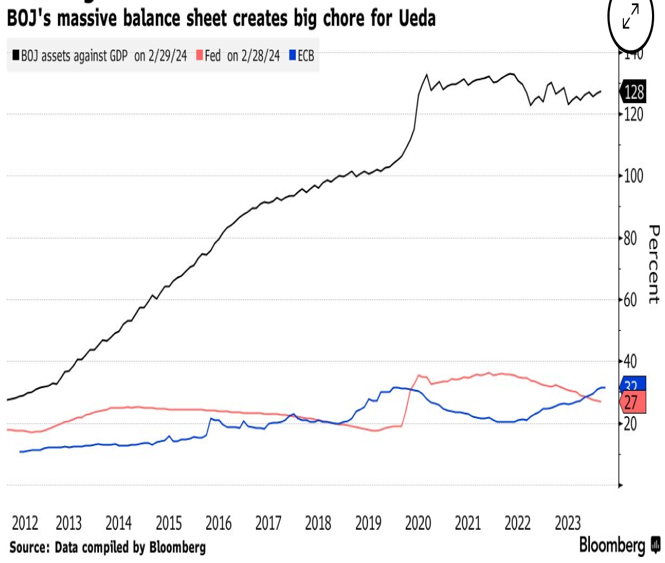
The BoJ's persistent zero (or slightly negative) interest rates have failed to stimulate aggregate demand and have served mostly to suppress debt service costs (including the government's) and distort financial markets and economic decisions. The BoJ's bloated balance sheet (its assets and liabilities) is dramatically higher as a percent of GDP than the Fed’s or ECB’s and magnitudes higher that any measure of reasonableness (Chart 3). Its asset purchases have created excess reserves in the banking system, the largest portion which are loaned back to the BoJ. The BoJ officially pays interest on excess reserves, which is tied to the BoJ’s policy rate and thus until recently has been zero. Commercial banks pay close to zero yields on deposits and generally have set rates on mortgages and consumer loans that provide positive returns to banks. Consumers lose from the BoJ’s policies.
Chart 3. The BoJ’s Balance Sheet/GDP Chart 4. The BoJ’s Policy Rate and Inflation
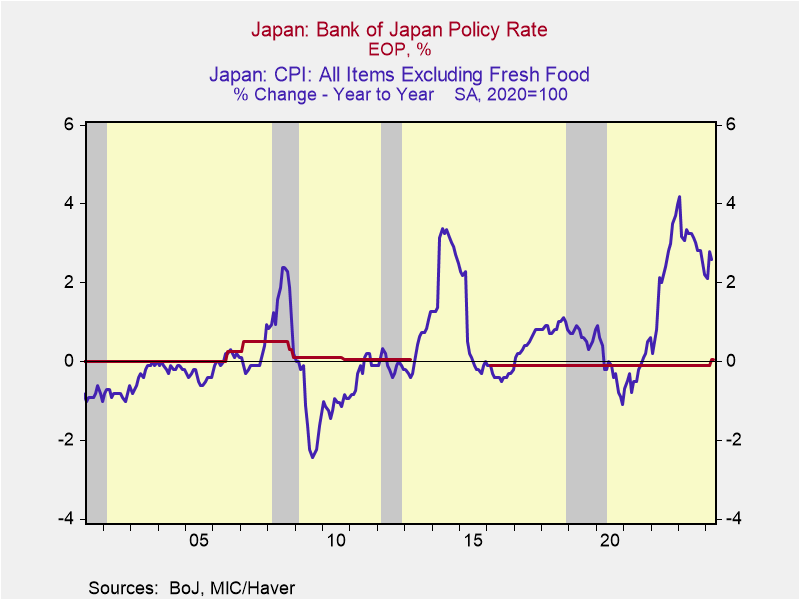
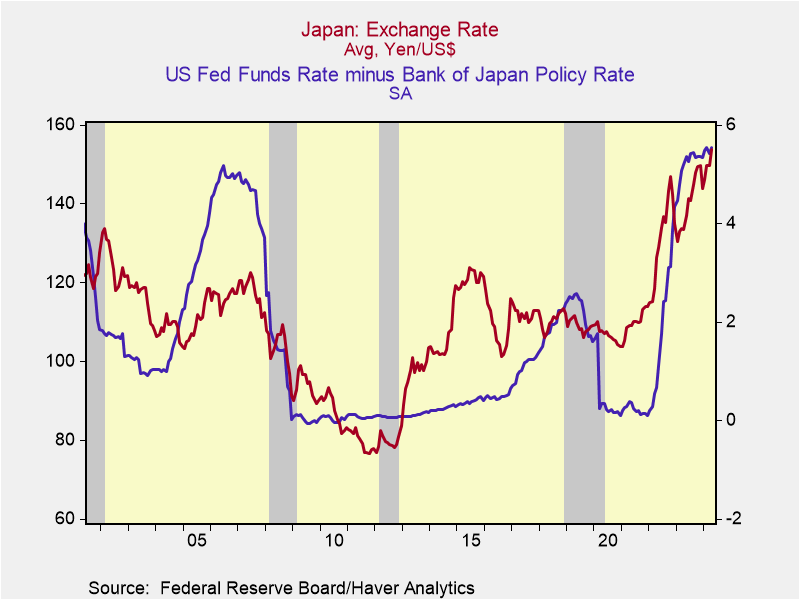
The divergent policies of the BoJ and the Fed have contributed to the marked weakness of the yen. In particular, the yen depreciated as the Fed raised rates in 2022 while the BoJ maintained a slightly negative real policy rate and its forward guidance suggested no future change. Even as the BoJ eased its yield curve control program, which allowed JGB yields to rise, the BoJ continued its asset purchases and the yen depreciation continued. Presently, the BoJ’s policy rate is more than 2 percentage points below inflation while the Fed’s policy rate (5.25%-5.5%) is roughly 2.5 percentage points above PCE inflation. Ex ante real JGBs are well below real US Treasury yields, although the comparison is clouded by the wide range of measures of Japanese inflationary expectations.10-year JGB yields have risen close 1% but inflationary expectations vary widely among different surveys and market-based measures. BoJ Governor Kazuo Ueda has indicated that longer-run inflation expectations are around 1.5%. 10-year Treasury bond yields of 4.5% are roughly 2 percentage points above inflationary expectations of 2.5%.
Chart 5. The Yen and Fed Funds Rate minus BoJ Rate
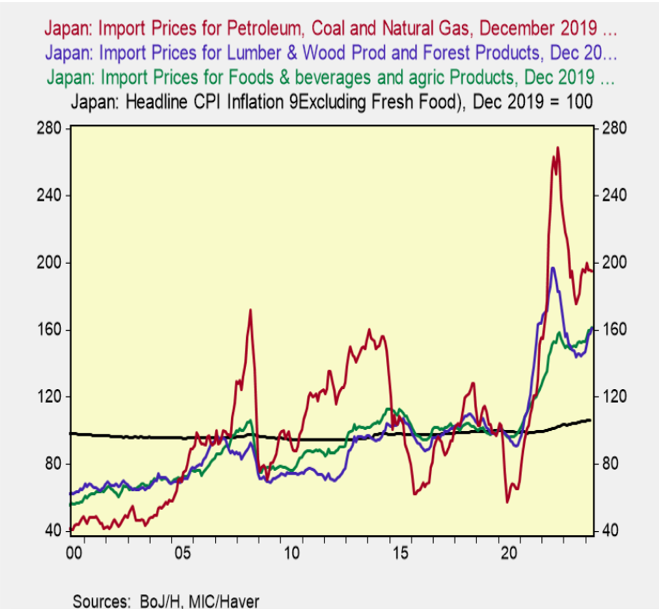
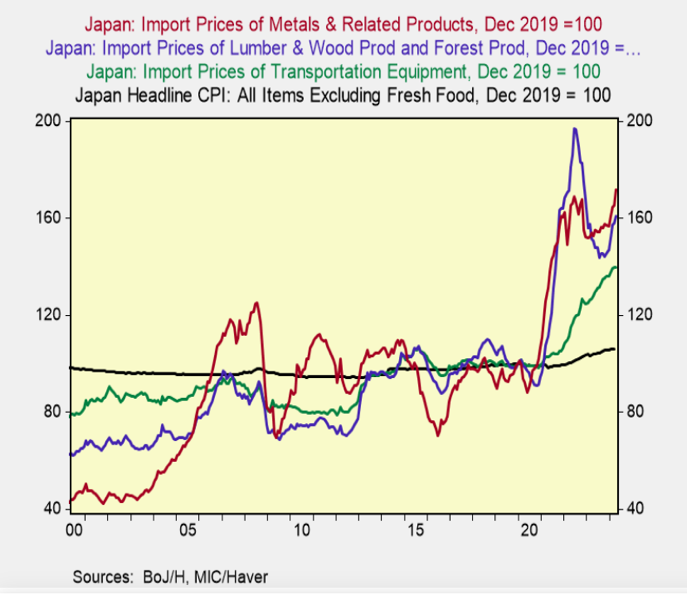
The weaker yen has benefited exporters by lowering their costs of production relative to overseas producers, but has raised the costs of imports. Japan's imports are a relatively high 18% of GDP. Japan imports nearly 100% of its oil and energy whose transactions are primarily US dollar-denominated. Prices of imported goods have risen dramatically: Chart 6 shows the cumulative price increases of goods that are consumer-oriented and Chart 7 shows cumulative price increases of goods used in production. Prices of oil and energy imports are included in Chart 6, but they affect production just as much. These high prices of imports have dented consumption and production, and they have also weighed on confidence.
Charts 6 and 7. Prices of Imported Goods, Consumer and Production-Related
Based on the higher inflation and rising inflationary expectations, and the burdens the weaker yen is imposing on Japan’s economy, the BoJ would be wise to raise its policy rate toward its 2% target and provide forward guidance that its intention is to normalize monetary policy. This would involve raising rates and implementing a gradual program of reducing its balance sheet. While the rate increases should begin immediately and continue through year-end 2025, the balance sheet adjustment necessarily must be slower. There are currently close to 3 trillion yen in excess reserves, and the BoJ holds large amounts of long-duration assets, including corporate bonds, and it also holds ETFs of equities, so a gradual unwind of the balance sheet would likely involve a 10-year program.
As the BoJ raises interest rates, commercial banks will profit from the sizable interest they receive from the BoJ on excess reserves. The steepening of the yield curve and higher interest margins will facilitate higher bank yields on deposits. Japanese pensions, including those managed by the Postal Saving System, and insurance companies will benefit. Consumers will be better off. It will take years to judiciously unwind the excess reserves in the banking system, such that bank lending is unlikely to be inhibited. The BoJ understands the negative impact of the weak yen on Japanese consumers and the economy. It’s only a matter of time before it raises rates.
Confidence will build as evidence shows economic improvement as the BoJ increases rates toward inflation and the yen appreciates. This will reinforce the yen and the domestic economy. The marked appreciation of the Nikkei has already begun to anticipate these favorable outcomes.

The Dilemmas Facing the Fed, BoE, ECB, and BoJ
Inflation in the U.S., Europe, and the UK has fallen from very high levels but remains above the central banks’ goals of 2%. Following the Fed’s, Bank of England’s (BoE’s) and European Central Bank’s (ECB’s) painful experiences of failing to forecast their higher inflations and then being forced to raise rates aggressively, they look forward to lowering their policy rates. Japan also experienced a sharp rise in inflation from near-zero that is now receding but remains above 2%, and following an extended period of negative and now zero rates, the Bank of Japan (BoJ) contemplates raising its policy rate.
When will it be appropriate for the Fed, ECB, and BoE to lower rates, and for the BoJ to raise rates? The answer varies, as each central bank faces far different circumstances.
The Fed’s, ECB’s, and BoE’s policy rate is above inflation, but by varying degrees, while the BoJ’s real policy rate remains negative. Current economic conditions vary significantly in the U.S., Europe, the UK and Japan, as do their productivity and potential growth prospects that affect their neutral rate of interest. While the Fed has a dual mandate (2% inflation and maximum inclusive employment), the BoE and ECB have single inflation mandates of 2%, but they tend to respond to real economic conditions as well. The Fed and the other CBs recently have emphasized their commitments to their 2% inflation target, but it's not entirely clear whether each would willing to pursue a monetary policy that would lower inflation to 2% if doing so may damage economic conditions. There are also currency considerations, as the US dollar has remained strong while the Japanese yen has been notably weak.
Inflation and Policy Rate Comparisons
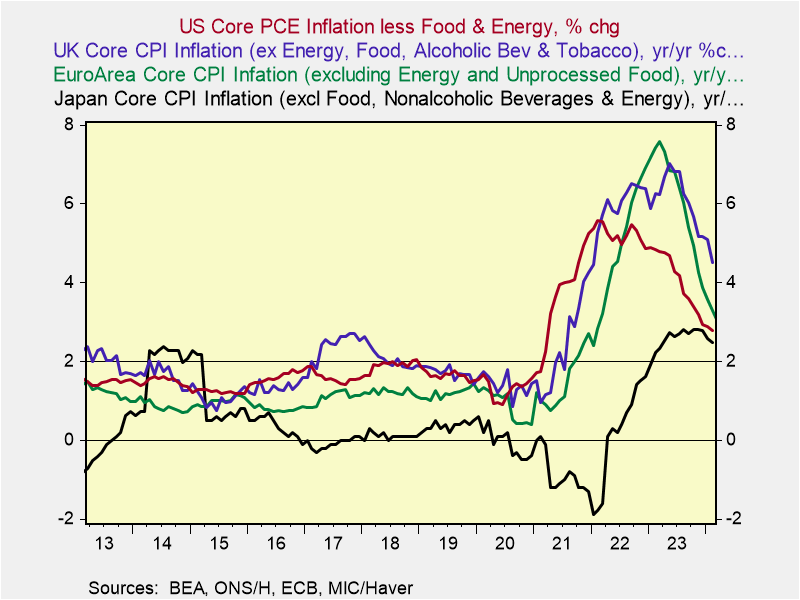
Inflation comparisons are shown in Charts 1 and 2 for both headline and core measures, and a 2% reference line for target inflation. The U.S.’s inflation is based on the PCE Price Index, the Fed’s preferred measure, while the others are CPI inflation. While inflation has subsided from high peaks, it remains above central bank targets. It soared the most in the UK and Europe. In the U.S., PCE inflation peaked at 7.2%, while its CPI inflation, which measures consumers’ out-of-pocket expenses, peaked at 9%. Japan’s inflation temporarily jumped to 4%. Currently, the UK currently stands out with the highest headline (3.8%) and core (4.7%) inflation.
Charts 1 and 2. International Comparison of Inflation
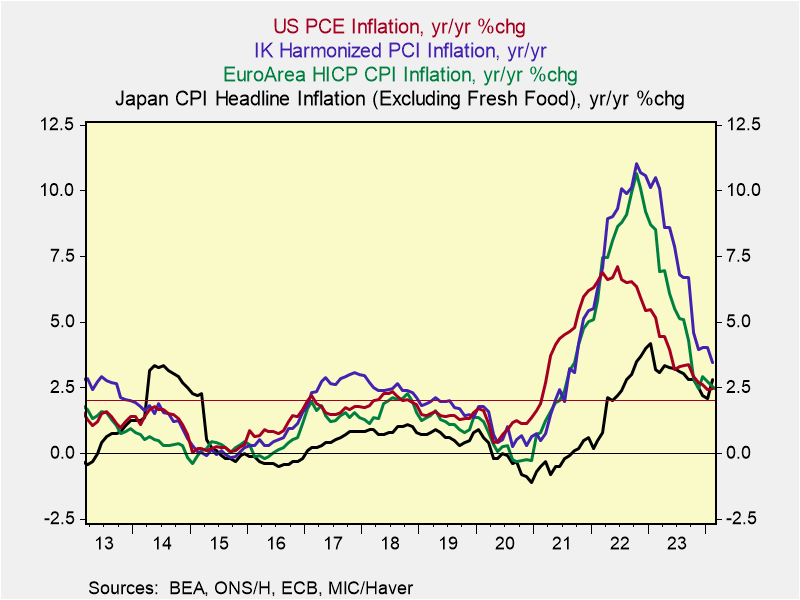
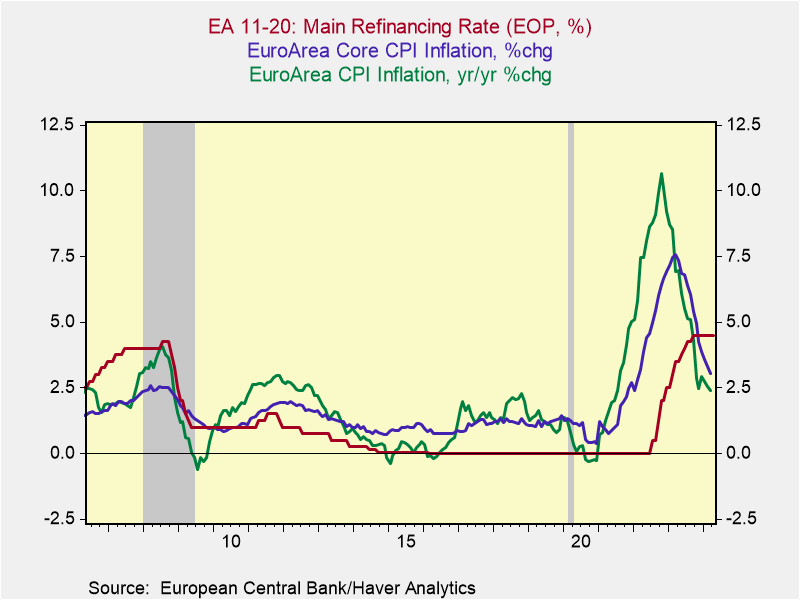
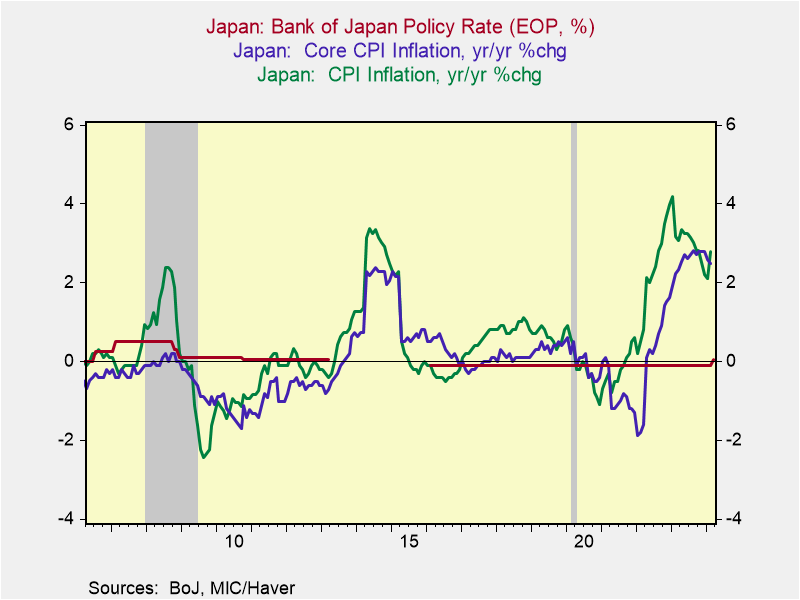
Charts 3-6 show the central bank policy rates of the Fed, ECB, BoE and BoJ relative to inflation in the U.S., the EuroArea, the UK and Japan. The Fed, BOE and ECB failed to respond on a timely basis to the surge in inflation and then raised rates aggressively in 2022-2023. The BoJ applauded Japan’s rise in inflation following a sustained period of near price stability, viewing it as a sign of economic improvement and hoping that it would lift inflationary expectations toward its 2% target.
Chart 3. Fed Funds Rate and U.S. Inflation Chart 4. BoE Policy Rate and Inflation
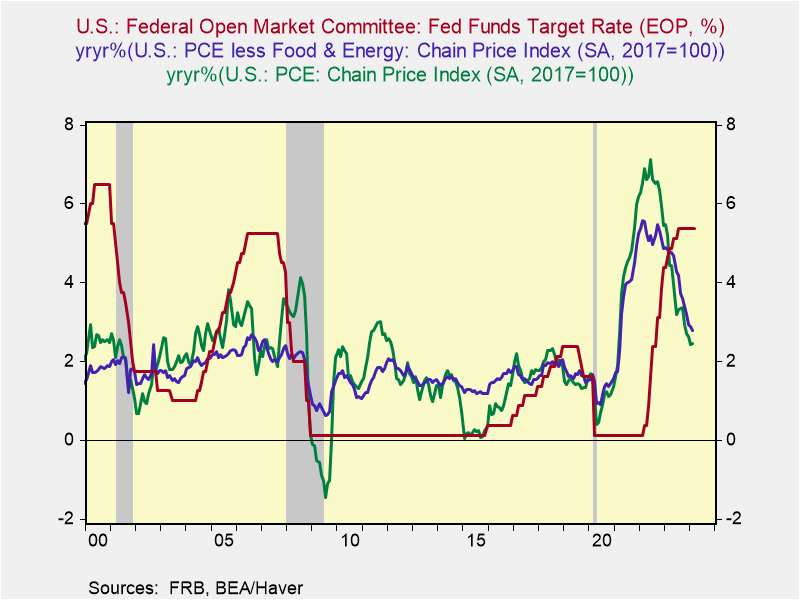
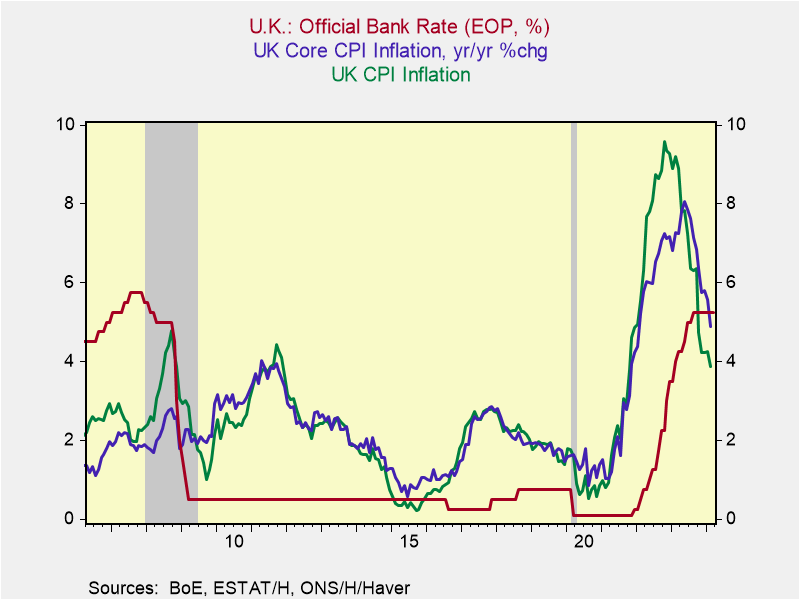
Chart 5. ECB Policy Rate and Inflation Chart 6. BoJ Policy Rate and Inflation
In each case, the central bank policy rate rose above inflation in 2023 through a combination of rate hikes and declines in inflation—in March for the Fed and later for the BoE and ECB. The BoJ raised its policy rate from minus 10 basis points to 0% in January 2024. Currently:
*The Fed’s 5.4% Fed funds rate (target rate is 5.25%-5.5%) is 2.7 percentage points above headline inflation and 2.6 percentage points above core inflation (Chart 3).
*The BoE’s 5.25% policy rate is 1.5 percentage point above headline inflation and 0.5 ppt above core inflation (Chart 4).
*The ECB’s 4.5% refi rate is 2.1 percentage points above headline and 1.8 percentage points above core inflation.
*The BoJ’s policy rate of 0%, recently increased from -10 basis points, is more than 2.5 percentage points below yr/yr inflation.
Assessing central bank monetary policy
The Fed, ECB and BoE have emphasized their commitments to reducing inflation to 2%. The challenge they face is determining the appropriate policy to achieve those goals. Recently, Fed Chair Powell and other FOMC members have characterized Fed monetary policy as restrictive, based on the observation that the real Fed funds rate is higher than any point since before the financial crisis. If inflation recedes further as FOMC members project, the real policy rate would rise further. The ECB and BoE also view their policies as restrictive and project that inflation will recede.
The critical issue is what policy rate constitutes "restrictive" monetary policy and what is neutral. That's a complex issue, reflecting inflation, inflationary expectations and the neutral rate of interest, which is influenced by economic conditions, productivity and potential growth, among other factors, and varies among the nations and their central banks.
Inflationary expectations in the U.S., Europe and the UK remain modestly above 2% and have been relatively sticky. In the U.S., market-based expectations of 10-year inflation are 2.3% while survey-based expectations are much higher, reflecting in part the 3.6%annualized PCE inflation in Q1 that halted the earlier trend of receding inflation. The University of Michigan consumer inflation expectations one year from now jumped to 3.5% and five years from now to 3.1%. The FRB of New York consumer surveys put inflation one year ahead at 3.0% and 5 years ahead at 2.6%. The sticky inflation has forced the Fed to back off its projection that three 25 basis point rate cuts in 2024 would be appropriate, and instead say it has delayed any rate cuts. Favorably, the Fed has confirmed its intention to reduced inflation to 2%. In Europe, a recent ECB consumer survey of 3-year ahead inflation was 2.5% for the median, but the mean expectation was substantially higher. Bloomberg survey of UK 1-year ahead inflation was 3.0%, reflecting sticky inflation. In Japan, the sustained period of near-zero inflation prior to the pandemic has weighed heavily on inflationary expectations, despite persistent efforts to raise expectations to 2%. Following years of nearly zero inflation, those expectations are rising, ever-so-gradually. In the latest survey, 83.3% of consumers expect prices to rise in one year and 80.6% expect prices will rise in 5 years. This doesn’t seem like much from the western perspective, but represents change in Japan, where expectations of true price stability had become the norm.
Real economic performance
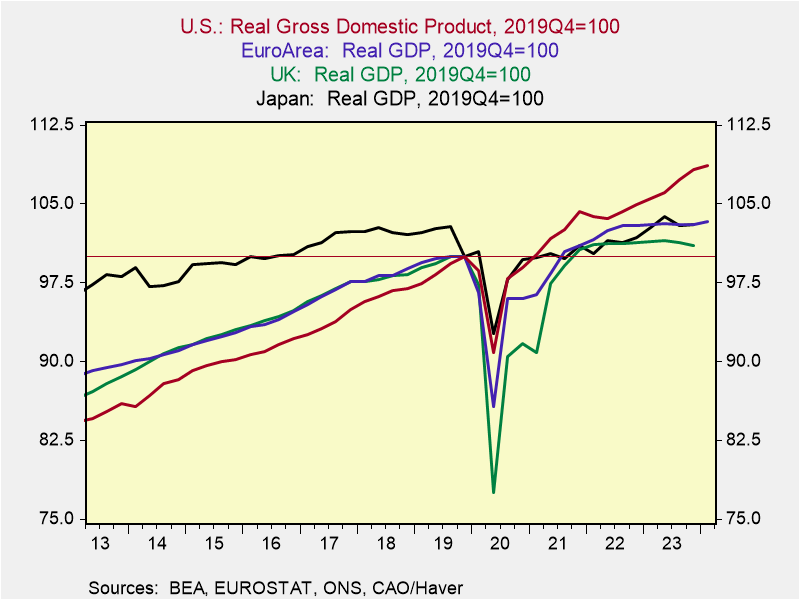
Europe and the UK have begun to recover from mild recessions in 2023, with growth in 2024Q1. Japan has continued to grow modestly faster than its longer-run potential, and U.S. economic growth has begun to simmer down following strong growth in 2023. The cumulative out-performance of the U.S.—both prior to and following the pandemic--has been dramatic, as shown in Chart 7.
Chart 7. International Comparisons of Real GDP, 2019Q4=100
EuroArea real GDP bounced back in 2024Q1 with 1.3% annualized growth following mild recession in 2023 marked by annualized RGDP declines of 0.2% in both Q3 and Q4. While consumption and gross business capital formation rose modestly in 2023, exports (-2.8%) and imports (-2.4%) both fell. Germany has been Europe’s underperformer. While its RGDP rose 0.9% annualized in 2024Q1, it fell 0.2% 2023 Q4/Q4, with sizable declines in both gross fixed capital investment (-0.8%) and exports (-3.3%). France and Italy both grew modestly in 2023 Q4/Q4 (+0.8% and +0.7%, respectively) and their pace of growth picked up in 2024Q1 (+1.2% and 1.2%, respectively). Spain was the EU’s outperformer, with 2.1% growth in 2023 and 2.9% in 2024Q1, led by healthy gains in consumption and gross capital formation but relatively flat exports. This change in economic leadership in Europe requires close scrutiny.
The UK economy also began recovering from 2023 recession, with reported increases of RGDP of 0.3% in January and 0.1% in February, following quarterly declines of 0.5% annualized in 2023Q3 and 1.2% in Q4. In 2023, notable weak sectors included exports (-7.6% in Q4/Q4) and housing construction that offset healthy gains in business investment in plant and machinery. The UK has a long way to recover. Its RGDP remains 1% below its 2019Q4 pre-pandemic level, as cumulative declines of 5.4% in exports and 2.1% in private consumption have offset 4.8% increases in gross capital formation (minus dwellings).
Japan’s economy grew at a healthy, above-potential rate of 1.3% in 2023 Q4/Q4, driven by strong gross domestic fixed capital formation (+4.2%) and exports (+3.7%) but modest declines in private consumption. In its most recent Outlook for Economic Activity and Prices Report released April 31, the BoJ projects that Japan’s economic growth will continue to exceed its estimate of longer-run potential through 2025, with resilient consumption supported by government efforts to offset higher gas prices, accommodative financial conditions that support continued employment and wage gains, healthy corporate profits and rising exports.
The U.S. enjoyed strong 3.1% RGDP growth in 2023 Q4/Q4, defying earlier expectations. Outsized gains in employment (4 million, averaging 333,000 per month) fueled rising personal income and consumption, business fixed investment posted gains and residential investment recovered following declines in 2022, and exports rose modestly despite flat global trade volumes. Growth slowed in 2024Q1, but not as much as the 1.6% annualized rise in RGDP suggests. Final sales to private domestic private purchases rose 3.1% in Q1, but real GDP was dragged down by slower inventory building and a wider trade deficit (exports rose 0.9% annualized while imports surged 7.2%). Employment gains slowed to 175,000 in April.
Economic performance, real rates and monetary policy
The neutral policy interest rate varies significantly across nations, reflecting differences in trends in productivity, potential growth, demographics and other factors. Based on recent and expected performance, the neutral policy interest rate is presumed to be the highest in the U.S., followed by the UK and the EU. Unique circumstances in Japan make the BoJ’s neutral rate more of a puzzle.
In the U.S., even though the Fed has the highest real policy rate since before the financial crisis, the economy has been resilient, growing faster than the Fed’s estimates of longer-run sustainable potential, calling into question whether monetary policy is as restrictive as the Fed suggests. As I argued in a recent Wall Street Journal
article, following several decades of a secular decline in the neutral rate of interest amid weak productivity gains, the neutral rate has risen reflecting the healthy economic growth, and a pickup in productivity and potential growth, which suggests the Fed has less room to ease rates and remain consistent with its objective of lowering inflation to 2% (“The Fed’s Latest Problem: A Strong Economy”, March 4, 2023).
Associated with its stronger economic growth, productivity has strengthened in the U.S. Its average annualized gain in the three years before the pandemic was 1.7%, a marked increase from its annualized 0.7% gain in the prior six years, and has continued to rise at a healthy clip, although the aggregate data have been highly volatile, buffeted by large swings in employment in the low productivity services industries and the shift from full-time to pull-time work. Productivity gains have been healthy in Japan, but they have languished in Europe and the UK (Chart 8).
I estimate intermediate sustainable potential growth in the U.S. to be at least 2.25% far above the Fed’s current 1.8% estimate of longer-run sustainable growth. Higher real expected rates of return associated with higher productivity and potential growth are attracting foreign capital and supporting a stronger U.S. dollar.
Chart 8. International Comparisons of Labor Productivity
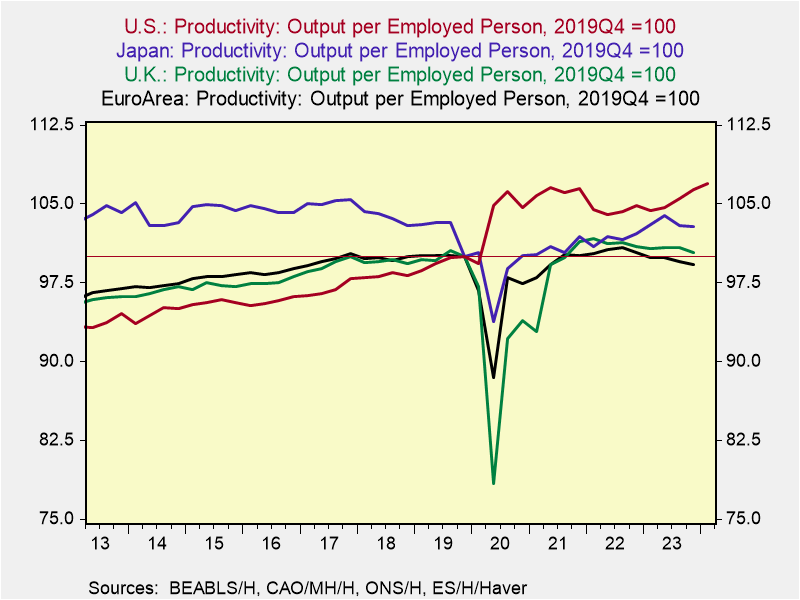
In contrast, productivity and growth have faltered in the EuroArea. Combined with unfavorable demographics affecting labor force growth, Europe’s outlook for sustainable potential growth has diminished, likely into the 0.75%-1.0% range. Of note, Germany had been Europe’s engine of economic growth, but that position began to erode before the pandemic, and in recent years, it has faced decided economic weakness and it lacks a viable strategy for its beleaguered automotive and energy-intensive industrial manufacturing sectors. Such potential growth is less than one-half of the U.S.’s. This is associated with a lower natural rate of interest and a weaker Euro.
A similarly soft productivity and growth pattern has unfolded in the UK, which has experienced a flattening of its labor force, despite a pickup in immigration. The IMF estimates UK potential growth to be 1.5%. Japan’s labor productivity of its working age population (age 16-65) is among the highest of all advanced nations. However, its healthy gains in productivity have been offset by weak demographics, marked by a declining and aging population that is reducing its labor force and low immigration, and traditionally Japan has not relied heavily on foreign workers.
The Outlook for Monetary Policy
The Fed has appropriately signaled that will delay any cut in rates. This is wise since inflation has backed up and interrupted disinflation while gains in employment and aggregate demand remain healthy. Of note, in Q1, nominal GDP rose 4.8% annualized and 5.5% yr/yr, consistent with sticky inflation, while real final sales to domestic purchasers (C+I) grew 3.1% annualized. Payroll growth slowed to 175,000 in April, but that pace of job gains is consistent with continued healthy growth in GDP, unless productivity slows abruptly, which seems unlikely.
The Fed remains fully data-dependent. Powell has stated that there is a very low probability that the Fed’s next rate move is up, and most Fed members await slower growth and a resumption of declining inflation they have projected so they can lower rates. (Whether the economic slowdown that seems to be unfolding is attributable to the Fed’s monetary tightening or merely a moderation from unsustainably fast growth is open to debate.) I continue to expect that will unfold and the Fed will begin cutting rates later this year.
However, the Fed has less room to lower rates. If the real neutral rate is 1.5%-2%, then eventually lowering rates to 3.5%-4% would be consistent with its 2% inflation target. In its latest Summary of Economic Statistics (SEPs), FOMC members estimated the longer-run fund funds rate to be 2.5%. The Fed tends to lag, and that estimate will rose very slowly.
The ECB has the most room to lower its policy rate, which is far above current inflation (Chart 6) while its neutral rate presumably has declined as its potential growth has diminished. Even though Europe’s economy is recovering from mild recession, it faces significant challenges. The ECB is expected to begin lowering rates mid-year 2024 and lower rates significantly through year-end 2025, and below 3% by mid-2026.
In the UK, even though inflation (4.6% headline and 3.7% core) remains far above the BoE’s 2% target, the BoE has signaled that it will begin cutting rates in June from its current 5.25% policy rate. The BoE’s decision revolves around two issues: first, the BoE places a high priority on maintaining the recovery from its recessionary conditions of 2023, and second, it expects inflation to fall significantly. This outlook is based on the BoE’s expectations that growth of aggregate demand will be weak, following its sharp deceleration in the second half of 2023, and the roll-off of the high monthly inflation data of 2023. But with inflation so high, providing forward guidance that it will be lowering rates is risky for the BoE.
The BoJ is gearing up to raise rates gradually and normalizing monetary policy to what it hopes is a new era of 2% inflation. Raising rates would also provide support for the battered yen, which is 155/USD after reaching 160/USD. Modest increases of interest rates toward 2% would elicit adjustments in financial markets. However, the BoJ’s sustained maintenance of a slightly negative policy interest rate since 2015 and expanded balance sheet had little apparent impact on real economic activity and inflation. As such, it seems unlikely that raising rates will have much effect.
The sequencing of these central bank policy changes will influence currencies. The yen is expected to strengthen. Monetary easing by the BoE and ECB before the Fed may keep the pound and Euro weak, although future markets have already begun to price in these changes. Once financial markets begin to anticipate that the Fed will lower rates, the US dollar is likely to weaken, but only modestly, in light of the outperformance of the U.S. economy and high expected rates of return on capital.