The U.S. stock market continues to outperform leading overseas markets, reflecting stronger economic growth and the rise in profits, and the expectations that these innovation and technology-drive trends will continue. In anticipation of this Thursday’s GDP Report, which is expected to record another healthy gain in U.S. GDP in 2023Q4, this brief assesses the longer-run trend in the U.S. economy and profits and highlights some important evolving trends.
International comparisons of stocks, profits and GDP
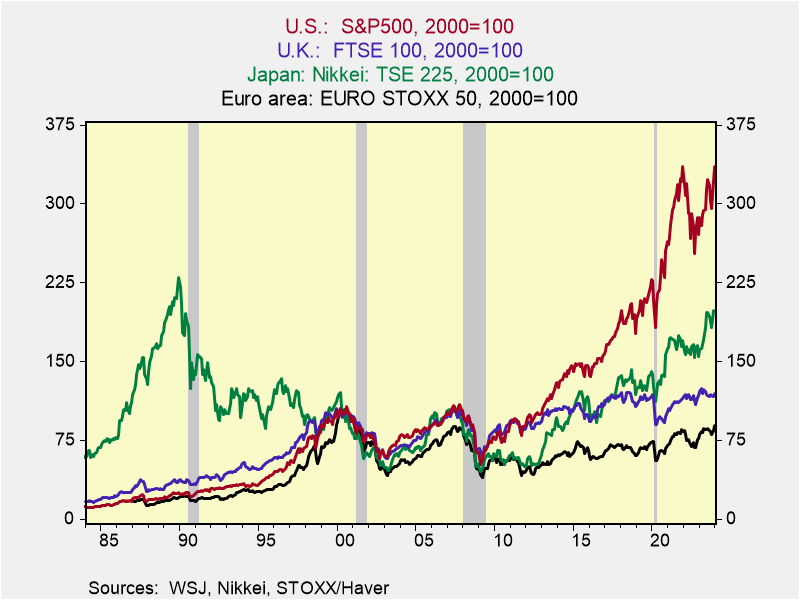
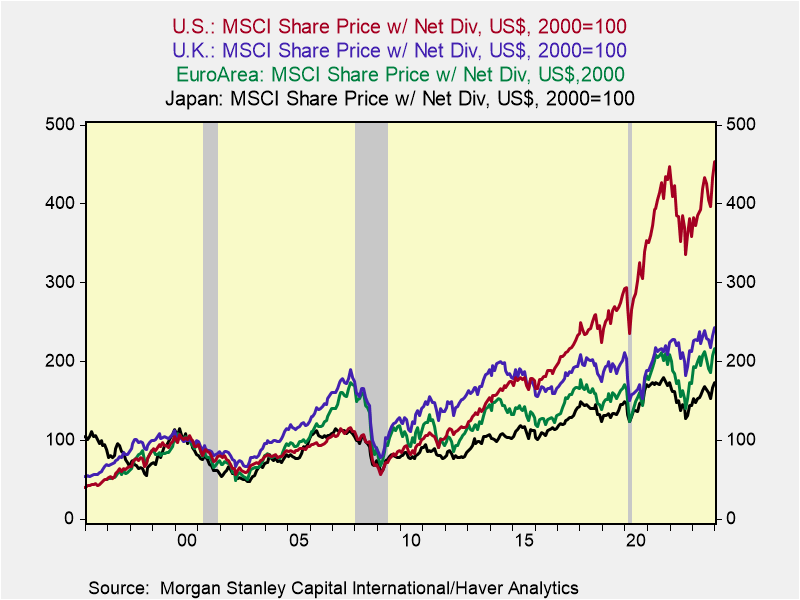
Chart 1 shows the cumulative appreciation of the S&P500 indexed to 2000 compared with the stock market performance of Japan’s Nikkei, the EuroArea EUROSTOXX, and the UK’s FTSE. The cumulative outperformance of the U.S. stock market, particularly since 2015, is striking. Chart 2 shows that comparing the stock indexes, including net dividends and measured in US dollar terms, provides similar results (Chart 2).
Chart 1. International Stock Indexes Chart 2. Stocks with Dividends
In US$
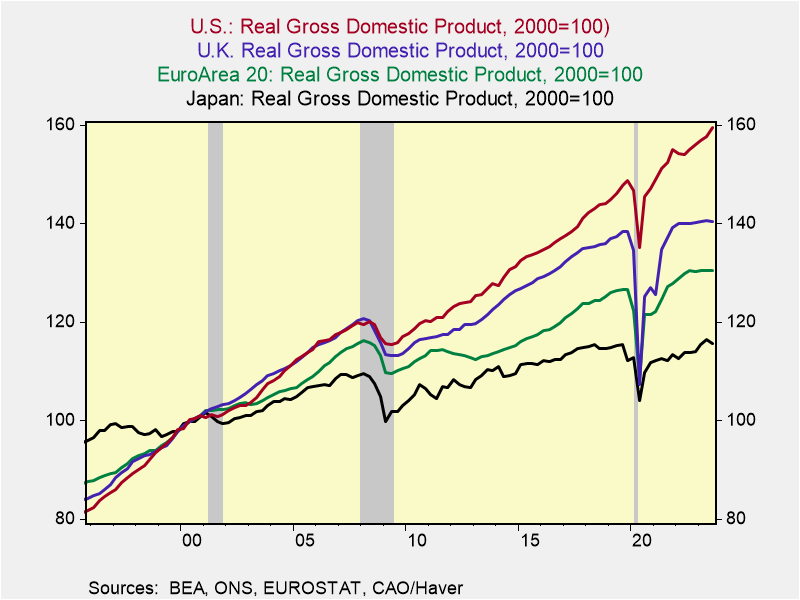
These stock returns mirror the relative outperformance of the U.S. economy and profits. Chart 3 shows the cumulative growth of real GDP since 2000 in the U.S., Japan, Europe, and the UK. The gap reflects the U.S.’s combination of faster gains in productivity and labor force. The U.S.’s pace of growth has decelerated over time, reflecting a combination of slower gains in labor force and productivity. Japan’s economic growth has been constrained by declining population and labor force; these trends have offset Japan’s highly productive workforce. Europe’s economy was harmed by financial crisis and has been constrained by overbearing regulations and high taxes and it faces major structural problems. The UK’s economy has been saddled by uncertainty stemming from swings in leadership and lack of a coherent economic growth strategy.
Chart 3. International Comparisons of Real GDP
Estimates of U.S. potential growth have diminished over time: Estimates by the Federal Reserve and the Congressional Budget Office center on 1.8%. I am more optimistic about potential growth, based on an anticipated pickup in productivity gains driven by the U.S.’s world-leading innovations and entrepreneurship, and increases in the labor force that will be driven, in part, by increased immigration. Even with Japan’s healthy productivity, its diminished labor force has constrained its potential growth to an estimated 0.5%. Europe’s potential growth is now decidedly below 1%, with a wide variance across its nations. While growth prospects in Spain and southern EU nations have improved, Germany, Europe’s largest economy and its engine of growth though roughly 2017, has faltered badly, faces significant structural problems, and is now a drag on Europe’s economy overall. The UK’s potential is modestly below the U.S.’s but suffers from a lack of policy stability and purpose that undercuts confidence.
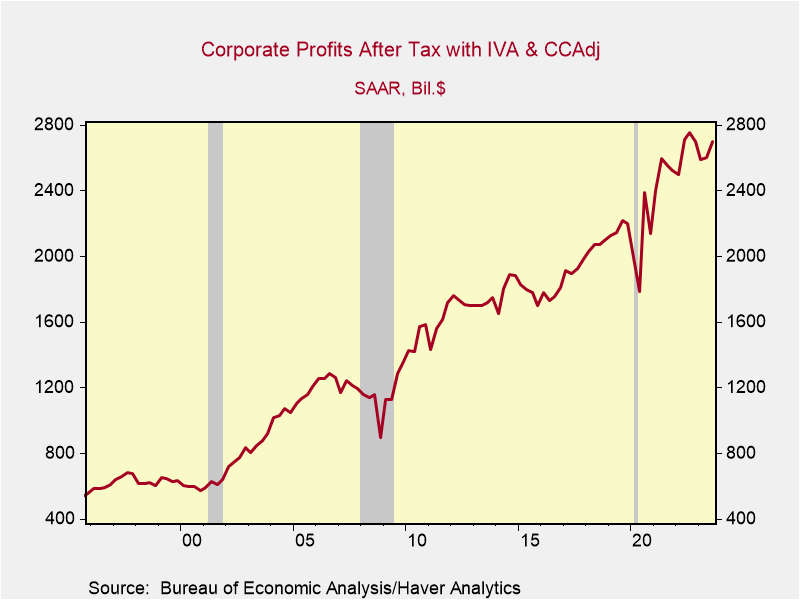
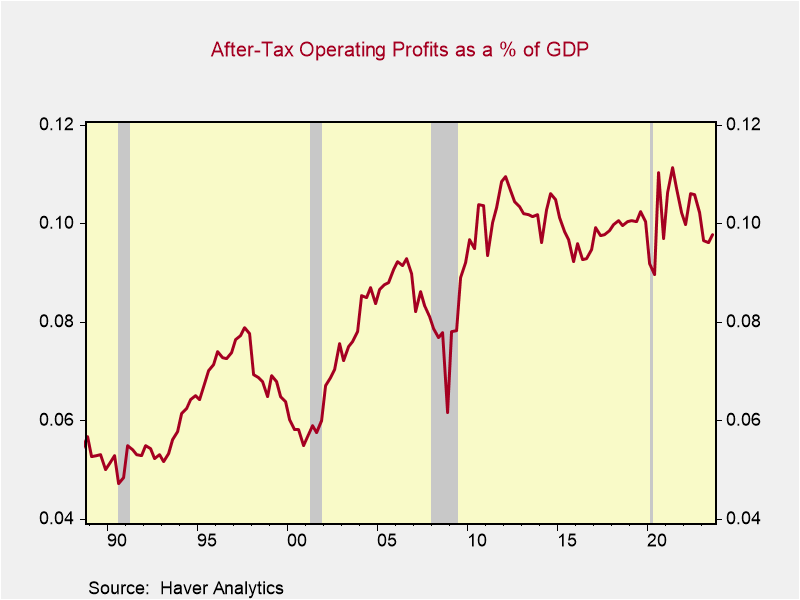
Comparisons across nations more problematic since the UK and EuroArea do not maintain data comparable to the U.S. or Japan. Chart 4 shows U.S. operating profits adjusted for inventory valuation and capital consumption allowances, indexed to 2000. Chart 5 shows after tax corporate operating profits as a percentage of GDP. They are high in historic terms but within their recent 10-year range. Based on corporate and profit data for S&P500 companies, U.S. profit growth is presumed to exceed those generated overseas. Of note, U.S. multi-national corporations generate repatriated profits from overseas activities that do not add to GDP, boosting the elasticity of profits relative to GDP. Presumably, Europe’s profits lag far behind, reflecting its slower economic growth, higher taxes and onerous regulations.
These relative trends in GDP, profits and stock markets, and the factors that drive them are embedded in expectations. Such high expectations reflect the optimism that the U.S.’s dominance in innovation and technological innovations and effective implementation into commerce will continue. They support the U.S.’s relatively high stock market valuations, independently of the discount rate of the future steam
Chart 4. U.S. Operating Profits Chart 5. Profits as a % of GDP
of earnings. Certainly, there are periods of outperformance of stocks in Japan, Europe, and the UK, but convergence of their stock price multiples with the U.S. should not be expected unless there is a convergence of expectations of economic growth or profits.
Profits in U.S. domestic industries have dominated net profits from overseas activities. The latter account for approximately one-sixth of total profits. Profits of U.S. nonfinancial industries have risen sharply since the pandemic, while profits in the private domestic financial sector have risen modestly. As shown in Chart 6, the Federal Reserve is now
Chart 6. Trends in Corporate Profits Chart 7. Trends in Nonfinancial Profits
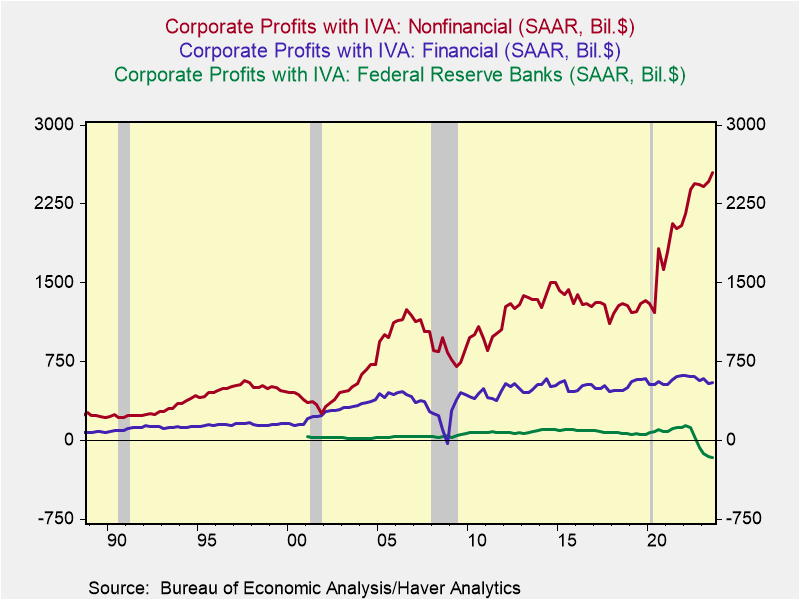
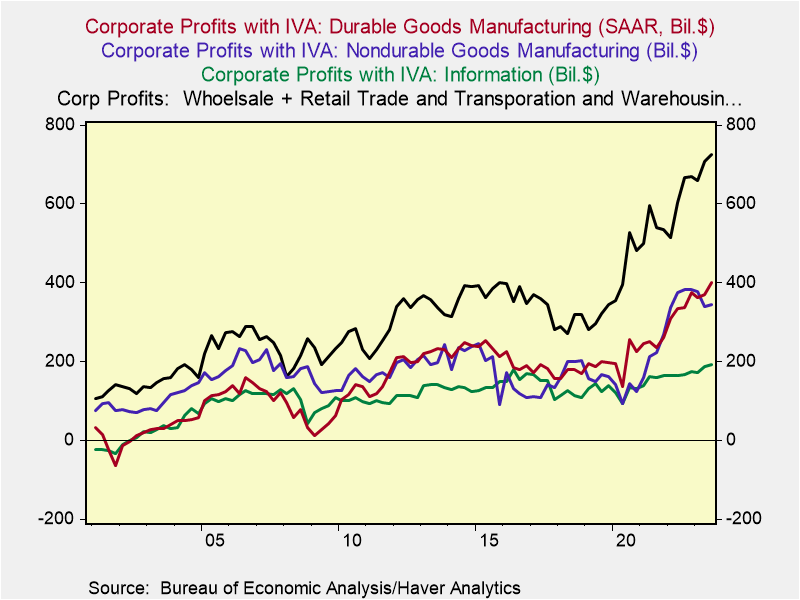
losing money, reflecting the adverse impact of higher interest rates on its bloated portfolio resulting from its massive asset purchases. Chart 7 shows the distribution of healthy profit gains across most nonfinancial industries. Profit gains in durable and nondurable goods manufacturing have been particularly strong since the pandemic.
Trends in U.S. GDP
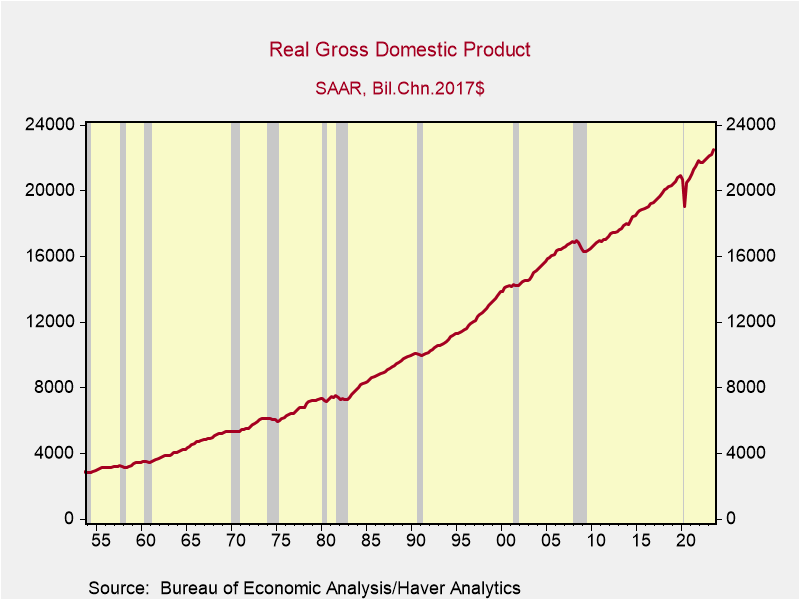
The longer-run trend of real GDP highlights its nearly persistent rise that is periodically interrupted by recession that with only a few exceptions — the mid-1970s, the Great Financial Crisis of 2008-2009, and the 2020 pandemic — seem rather minor (Chart 8). Of course, quarterly and yr/yr changes are much choppier and reveal the cyclical fluctuations in GDP that dominate financial market analysis and media coverage. But it’s the longer-term upward trend in real GDP that is the primary driver of economic progress and higher standards of living.
Chart 8. Longer-run Trend in Real GDP
Among the components of real GDP, several trends stand out. Consumption remains roughly 68% of GDP, close to a high, reflecting the rise in consumption of goods as a
percent of GDP and the modestly declining share of consumption of services. Goods consumption has been driven by spending on recreational goods and vehicles, particularly since the pandemic. The share of nondurables consumption has diminished over time, but has jumped since the pandemic. The declining share of consumption of services as a percent of GDP reflects falling real spending on financial services and insurance, reflecting narrower margins, along with flatter real consumption of housing and utilities.
Most strikingly, the share of nonresidential investment has risen dramatically — climbing to 14.5% from 9% in the 1990s and 12% during the 2010-2019 expansion. This reflects the surge in business investment spending on software and R&D. During the same period, investment in structures and industrial equipment has lagged the growth in real GDP. As described in earlier reports, the dramatic rise in business spending on software and R&D has been at the center of the innovation- and technology-driven growth of the economy, and has also served to dampen the cyclicality of the economy (Factors Supporting a Soft-Landing, December 10, 2023).
Residential investment, which includes new home construction and home improvements, peaked at 6.9% during the debt-financed housing bubble in 2007 and has diminished to 3.3%.
Exports have declined to 11.1% of real GDP, a modest decline from their average in 2010-2019, while imports have continued their rise, climbing to 15.2%. This has resulted in a widening of the real trade deficit to 4.1% of GDP, reflecting the extent to which domestic demand exceeds domestic production — and a widening current account deficit.
Government purchases — consumption and investment — that directly absorb national resources and are counted in GDP have gradually diminished over time, and now stand at 17.1%, down from 25% in the 1980s. At the same time, government deficit spending has continued to rise, reflecting the compounding increases in transfer payments, largely entitlement programs that provide income support. This involves the ongoing shift in the direction and purpose of government spending, allocating more resources toward income support and redistribution.
The biggest swing factor in government purchases as a percent of real GDP has been spending on national defense, which declined sharply in the 1990s from 7% of GDP to 4% and has drifted down to its current 3.7%. The recent increases in government investment in infrastructure spending on defense has contributed to real GDP growth (Fiscal Policy and the Fed Work at Cross Purposes, September 9, 2023).
Real GDP and its components convey critical information about trends in the economy and business environment. The upcoming GDP Report for 2023Q4 will not disappoint.