Trends Influencing 2024’s Economic and Political Landscape
Along with the health of the U.S. consumer, four economic trends at the forefront of the political economy — the flattening of international trade, China’s economic slump, the decline in inflation amid continued rise in consumer prices, and the U.S. housing market — will influence the economic and political landscape in 2024.
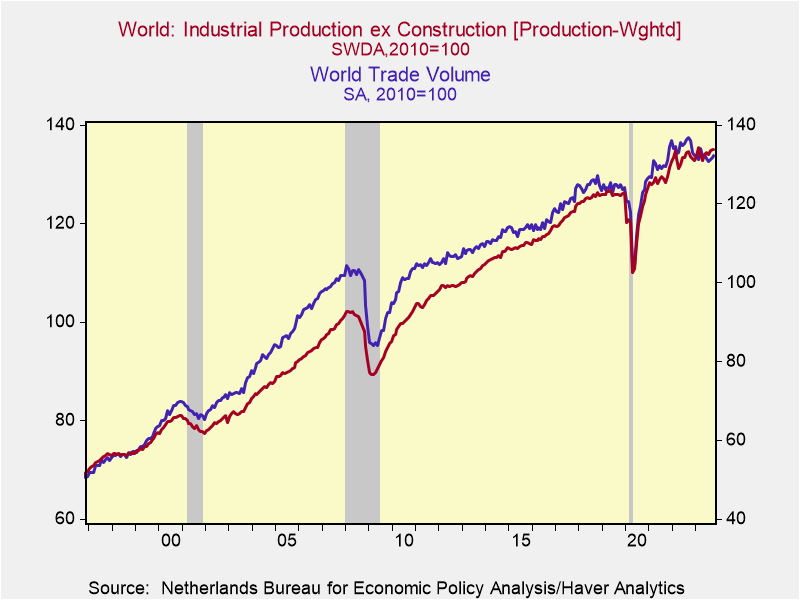
International trade. Global trade volumes have flattened, as nations are retreating into regional shells (including a rapidly growing trading bloc centered around China, Russia and Iran), global corporations are restructuring their supply chains (away from China) and facing higher costs of financing trade and global supply chains, and physical trade is being inhibited and threatened by military and terrorist attack. These trends are a negative for global growth and efficiencies (Chart 1).
Chart 1. Global Trade and Industrial Production
So far, the biggest brunt on international trade has been felt by the United Kingdom and Europe, where exports and imports are down significantly since before the pandemic. Japan has also been adversely affected by its large trade exposure with China. The U.S. is better situated (Chart 2): although it has smaller relative export exposure than the UK, Europe, Japan and other advanced economies as a percent of GDP, its exports have continued to grow. Fortunately, its two largest trading partners — Mexico and
Chart 2. International Comparisons of Exports
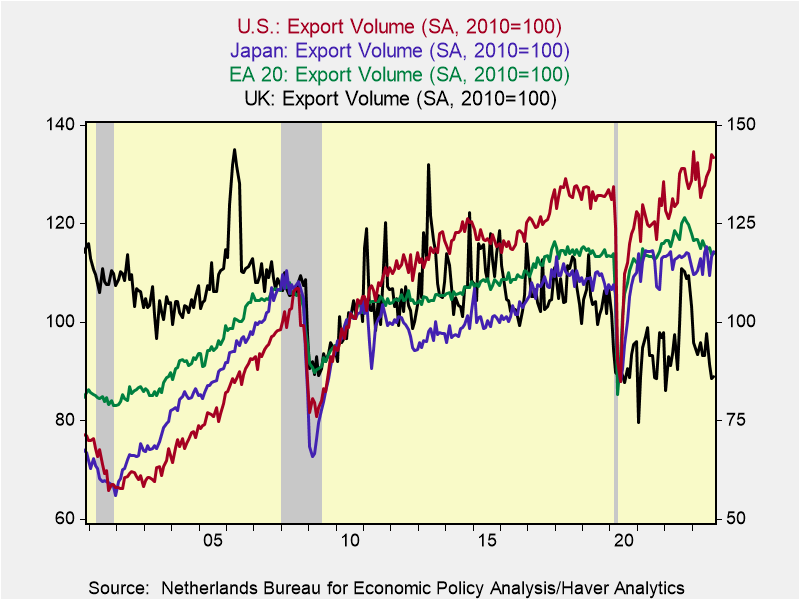
Canada — are also relatively insulated from China’s economic weakness and continue to grow. Mexico (and, to a lesser extent, other Latin American nations, including Brazil) is well positioned to benefit as it becomes an attractive center for production for global companies.
Nevertheless, the unwind and restructuring of global supply chains away from China is costly in terms of efficiency, and in the short run imposes economic costs that exceed any benefits stemming from onshoring of production and jobs. As James Manyika and Michael Spence state in “The Coming AI Economic Revolution” (Foreign Affairs, November/December 2023): “The era of building global supply chains entirely on the basis of efficiency and comparative advantage has clearly come to a close.” Moreover, the distortions and geopolitical risks stemming from the Russia-Ukraine war and war in the Middle East are raising the costs of trade and suppressing international trade, at least temporarily. Moreover, a concern looms: the weakness and disruptions to international trade may be significantly accentuated if Donald Trump were to be elected president and impose tariffs and barriers to trade, as he has promised to do.
China. China’s deflation — its yr/yr consumer price index has fallen for three consecutive months — is a direct consequence of insufficient aggregate demand and economic slump. Don’t look for any positive economic turnaround in 2024 in China, and take the official data published by China’s National Bureau of Statistics with a big grain of salt. The Chinese government is trying to stabilize home values and expectations, lift confidence, and encourage consumer spending. China’s official data put real GDP growth at 5% but a more realistic assessment is closer to 1½% (see Rhodium Group, “Through the Looking Glass: China’s 2023 GDP and the Year Ahead”, December 29, 2023). Such growth is not sufficient to maintain employment and wages. The deflation adds to the lack of confidence and social unrest, particularly among China’s youth that must adjust down expectations about their future. That’s the cost of a Communist dictatorship.
As described in earlier papers (“China’s Bill Comes Due,” September 19, 2023), President Xi’s clampdown on U.S.-style free enterprise has undercut innovation and productivity while the gross misallocations of resources that culminated in unsustainable excesses in real estate as Chinese leaders attempted to maintain unrealistically high levels of GDP growth have unraveled. The collapse in the government-generated excesses in real estate has generated sizable losses in household net worth and generated a sizable hole in local government finances. The former has dampened consumer spending while the latter has severely undercut local government finances and constrained China’s ability to finance fiscal stimulus. Similar with Japan’s asset price bubble in the late 1980s and the U.S.’s debt-financed housing bubble in the early 2000s, the adverse consequences for China’s consumers and domestic demand will be felt for years.
At the same time, global demand for China’s goods and production have been slowed by economic weakness in Europe and the UK and select emerging nations, along with efforts of global companies and advanced nations to reduce supply chain exposure to China. This reduces jobs in China’s export-related manufacturing industries. These negatives have been mitigated by China’s booming production and exports of EVs and strong gains in exports to Russia, Iran and the Middle East. The building of this new axis of trade has been a distinct positive for China, but not nearly enough to offset the weakness in trade with advanced economies.
In summary, China is no longer the engine of global growth and world economies must adjust.
Disinflation but higher prices. The decline in inflation — measured yr/yr, CPI inflation has receded to 3.3% and 4.0% excluding food and energy (3.3% and 3.2% annualized in the last six months) — has resulted in an increase in real (inflation-adjusted) wages and purchasing power. Real average hourly earnings rose 1.0% in the year ending December 2023, retracing one-half of the decline in 2021-2022. And recent declines in energy prices have boosted purchasing power (Chart 3).
Chart 3. Average Hourly Earnings and Inflation
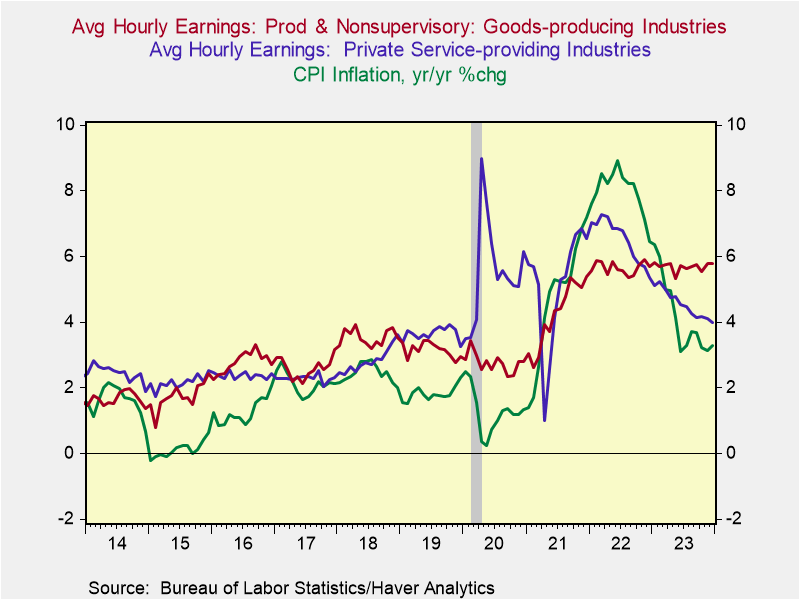
The lower inflation is a distinct positive for consumers and economic performance. On the other hand, prices of goods and services continue to rise, and following the 2021-2023 surge in inflation, they are dramatically higher than pre-pandemic levels. These price increases have impinged on standards of living for households and the price sticker shock is resonating in election year politics.
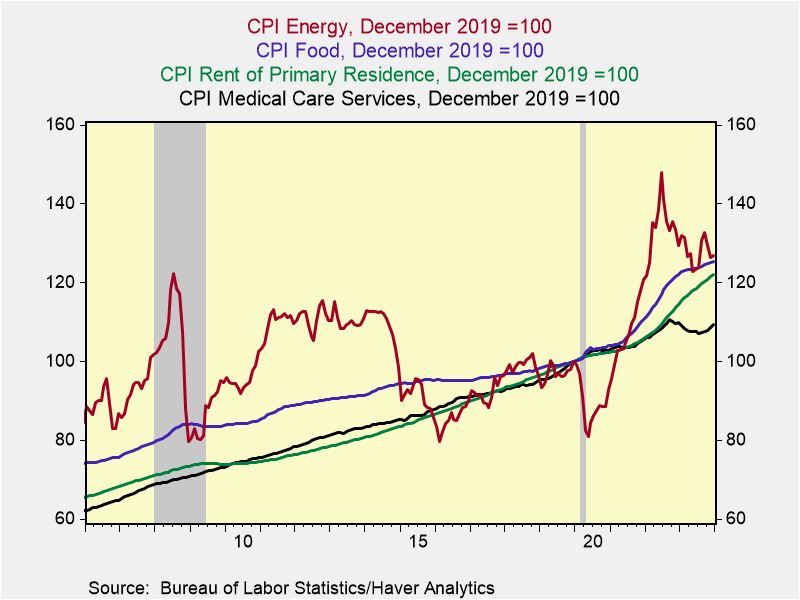
Since before the pandemic (December 2019), prices of food have risen 25.4%, rental costs are up 21.9% and even with the simmering down of energy costs, energy prices are up 26.9%. Of note, the large laggard in price increases has been health care costs that are up only 9.3% since late 2019 (Chart 4). One factor underlying this subdued price increase may be the government’s efforts to constrain budget outlays for Medicare, Medicaid, and other subsidized health care that has involved squeezing reimbursable schedules. This would affect the price changes recorded for an array of medical care services. (Note the CPI measures price changes of out-of-pocket consumer expenditures, while PCE inflation measures price changes of total consumer expenditures including those paid for by Medicare, Medicaid and corporate health care insurance.)
Chart 4. Price Increases since Before the Pandemic
The Fed’s stated mandate is 2% average longer-run inflation, and the objective of its strategic plan is to let bygones be bygones, with no intention of a makeup strategy that would offset the 2021-2022 surge in inflation.
The higher prices are having the largest impact on lower- and middle-income households who are renters and face dramatically higher costs of living but have not benefited from home ownership or the stock market appreciation. The resulting impacts on real incomes and wealth of households with different social and demographic characteristics may influence perceptions and affect election outcomes.
U.S. Housing. New and existing home sales and construction have been constrained by insufficient supply and the sharp rise in mortgage rates through October 2023. The constraints on supply of existing homes stemming from low mortgage rate lock-ins has only compounded the shortfall in the housing stock that accumulated during the 2010-2019 expansion when new unit construction was persistently below the growth in demand associated with new family formation. These imbalances have contributed to stubbornly high home prices and decades-low home affordability index. Meanwhile, healthy labor mobility continues to support housing demand in medium and smaller-sized cities.
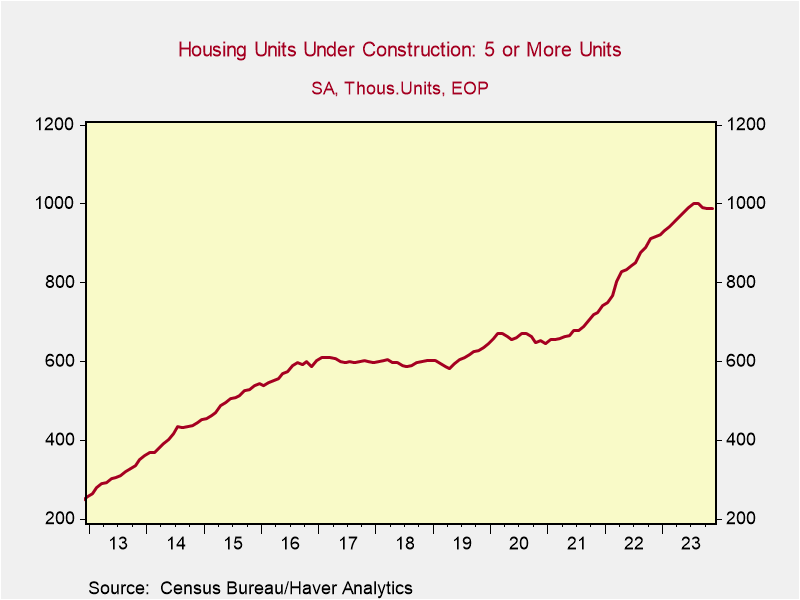
Relief may be coming: the recent sizable decline in mortgage rates has improved home affordability and will increase demand, and, according to the U.S. Census Bureau, the number of completions of apartments that will come on the market in 2024 will be 50% higher than the record-breaking 444,000 in 2023 (Chart 5). These increases in supply and demand along with lower mortgage rates are expected to increase sales while providing some relief on prices. Not surprisingly, contractors are expecting a strong homebuilding season in Spring 2024.
Chart 5. Multi-Family Housing Units under Construction
As described in recent briefs, these positive factors of disinflation and housing are expected to support continued economic expansion in the U.S., while the impacts stemming from constraints on international trade and China’s ongoing economic woes are negatives and require scrutiny.