How will stocks fare and what will happen to interest rates during this Presidential election year? These questions are viewed through three lenses: 1) a historical assessment of economic and financial performance during Presidential election years going back to 1960, including the performance of the S&P500 during Presidential election years, along with changes in the Federal funds rate, inflation, real GDP, employment and the unemployment rate as highlighted in the table below, 2) recent research on Federal Reserve behavior during election years, and 3) prior research on the cyclical linkages between the S&P500, corporate profits and economic expansions.
In summary,
*The stock market tends to appreciate during Presidential election years as long as the economy is expanding, regardless of whether the Fed is raising or lowering rates, and
*The Fed responds to inflation and the economy and labor market conditions in the same manner during Presidential election years as during off-election years; also of note
*Incumbent party Presidential candidates tend not to be re-elected when election years involve recessions.
Thus, financial market outcomes in 2024 depend critically on whether the economy continues to expand. Continued economic expansion in 2024, as I project, would support stock appreciation. Of course, international conflicts, turmoil surrounding the Presidential election and other risks must be taken under consideration. As long as economic growth doesn’t accelerate materially above longer-run potential and inflation stays at current levels or below, the Fed will lower rates. Obviously, economic performance will heavily influence the election.
Column 1 in the table below shows the percentage change in the S&P500 during every Presidential election year since 1960, measured from December of the prior year to December of the election year. Election years that involved recession are designated with an (R) and those when the incumbent party candidate was elected are designated with an (*). The other columns show election year economic trends (real GDP, employment and the unemployment rate, Columns 4 and 5), inflation (Column 3) and the Federal funds rate (Column 2).
Stocks have tended to rise during election years, with the primary exception when the economy was in recession: in 1960 (the NBER designated a recession from April 1960-February 1961), 2008 during the Great Financial Crisis, and 2000 (following the dot.com bubble and in anticipation of the 2001 recession). The S&P500 was virtually flat during the 1984 Presidential election year (December 1983-December 1984) following a 50% rise from its August 1982 trough. In 2020, stocks rebounded sharply and registered healthy yr/yr gains following the sharp Covid recession and stock market contraction in the first half of the year. In most other election years, the S&P500 registered double-digit gains, even when they followed healthy gains in prior years.
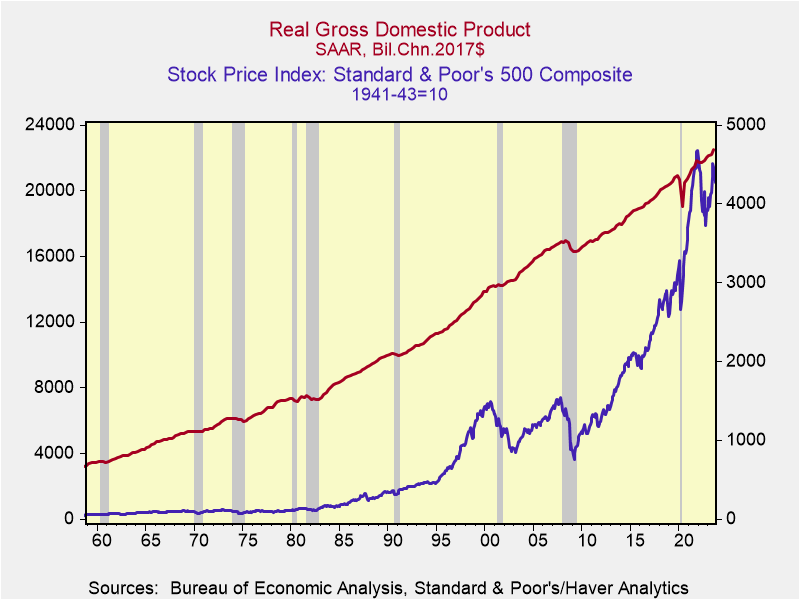
The focus of an earlier report on the cyclical behavior of corporate operating profits and the S&P500 (“U.S. Stock Market and Economy: Room to Rise”, June 2022) provided a key finding that is relevant to current observations. It found that while operating profits always peaked mid-expansion cycle, the S&P500 continued to rise as long as real GDP expanded and peaked at or just prior to the onset of recession. This underlines the importance of the economy in supporting the stock market.
A comparison of the S&P500 and the Fed funds rate in Columns 1 and 2 suggest that during most Presidential election years when the economy was expanding, the S&P500 tended to appreciate regardless of whether the Fed was raising or lowering rates. In those years, the direction of change of interest rates did not materially influence election outcomes.
Regarding Federal Reserve behavior during election years, my research has shown that the Fed has conducted monetary policy during election years in a manner similar to off-election years, with only one (1972) exception. The Fed’s tendency has been to adjust the Federal funds rate in response to deviations of the unemployment rate and inflation from the Fed’s central tendency forecasts. When the unemployment rate rises (falls) outside the range of the Fed’s CTFs, the Fed lowers (raises) rates, and it raises (lowers) rates when inflation rises above (falls below) the CFT. My empirical research shows that this Federal Reserve reaction function holds during presidential election years (“The Fed Won’t Try to Boost Biden”, Wall Street Journal, December 26, 2023; the title of the manuscript I submitted was more appropriate: “The Fed Lies Low in Election Year Politics”)
The Fed has already sharply cut its 2024 projections of core PCE inflation for Q4/Q4 (CTF, 2.4%-2.7%) and is projecting a modest rise in the unemployment rate from its current 3.7% to 4.1% in 2024Q4; CTF 4.0%-4.2%). While the Fed has announced its intention to cut rates in 2024, the CTFs suggest a high hurdle for doing so. However, the Fed’s reaction function must be considered within the current context in which the real Fed funds rate has risen to 2.2 percentage points, resulting in a rise in the Fed’s policy rate target to 5.25%-5.5% and a decline in core yr/yr inflation to 3.2%. Despite the Fed’s ongoing efforts to estimate the natural rate of interest (r*) consistent with achieving its dual mandate (2% inflation and maximum employment), uncertainty abounds. The bottom line is the Fed’s policy deliberations will be particularly data dependent, and considered independently of the of the highly charged presidential election campaign.
Stock Market and Economic Performance during Presidential Election Years
 Sources: Standard & Poor’s, Federal Reserve Board, Bureau of Labor Statistics, Bureau of Economic Analysis/Haver Analytics
Notes: R indicates that a recession occurred during the year; * indicates incumbent party candidate is elected; yr/yr percent change and percentage point changes are measured December of prior year to December of the election year; **Empl is establishment payrolls and UR is the unemployment rate.
Chart 1.