U.S. GDP, Profits, and the Stock Market
The U.S. stock market continues to outperform leading overseas markets, reflecting stronger economic growth and the rise in profits, and the expectations that these innovation and technology-drive trends will continue. In anticipation of this Thursday’s GDP Report, which is expected to record another healthy gain in U.S. GDP in 2023Q4, this brief assesses the longer-run trend in the U.S. economy and profits and highlights some important evolving trends.
International comparisons of stocks, profits and GDP
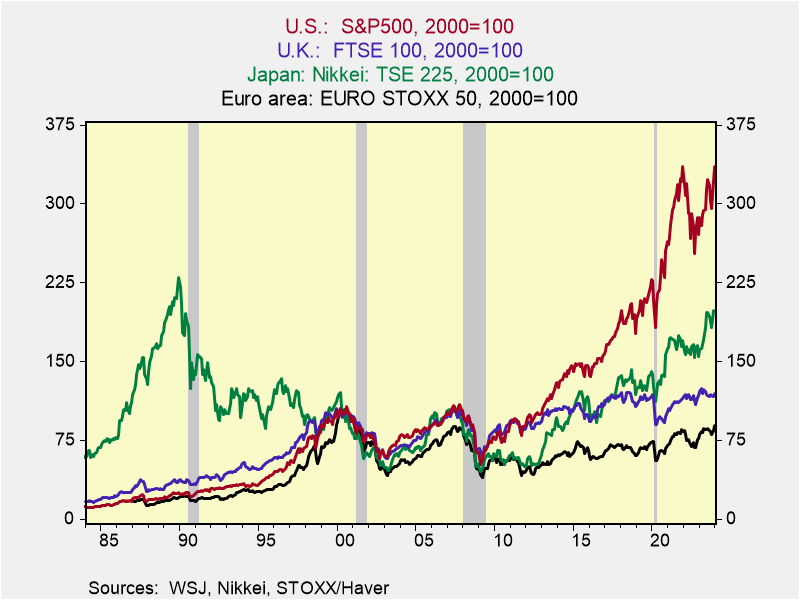
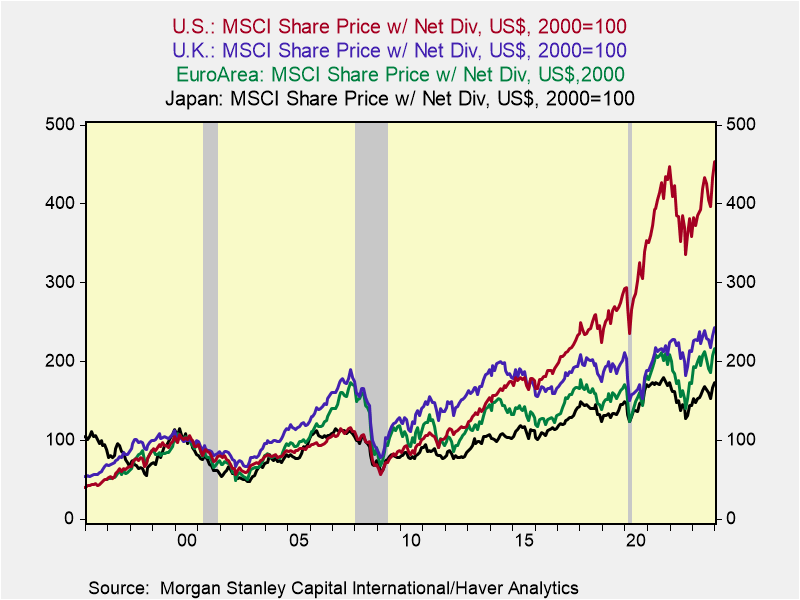
Chart 1 shows the cumulative appreciation of the S&P500 indexed to 2000 compared with the stock market performance of Japan’s Nikkei, the EuroArea EUROSTOXX, and the UK’s FTSE. The cumulative outperformance of the U.S. stock market, particularly since 2015, is striking. Chart 2 shows that comparing the stock indexes, including net dividends and measured in US dollar terms, provides similar results (Chart 2).
Chart 1. International Stock Indexes Chart 2. Stocks with Dividends
In US$
These stock returns mirror the relative outperformance of the U.S. economy and profits. Chart 3 shows the cumulative growth of real GDP since 2000 in the U.S., Japan, Europe, and the UK. The gap reflects the U.S.’s combination of faster gains in productivity and labor force. The U.S.’s pace of growth has decelerated over time, reflecting a combination of slower gains in labor force and productivity. Japan’s economic growth has been constrained by declining population and labor force; these trends have offset Japan’s highly productive workforce. Europe’s economy was harmed by financial crisis and has been constrained by overbearing regulations and high taxes and it faces major structural problems. The UK’s economy has been saddled by uncertainty stemming from swings in leadership and lack of a coherent economic growth strategy.
Chart 3. International Comparisons of Real GDP
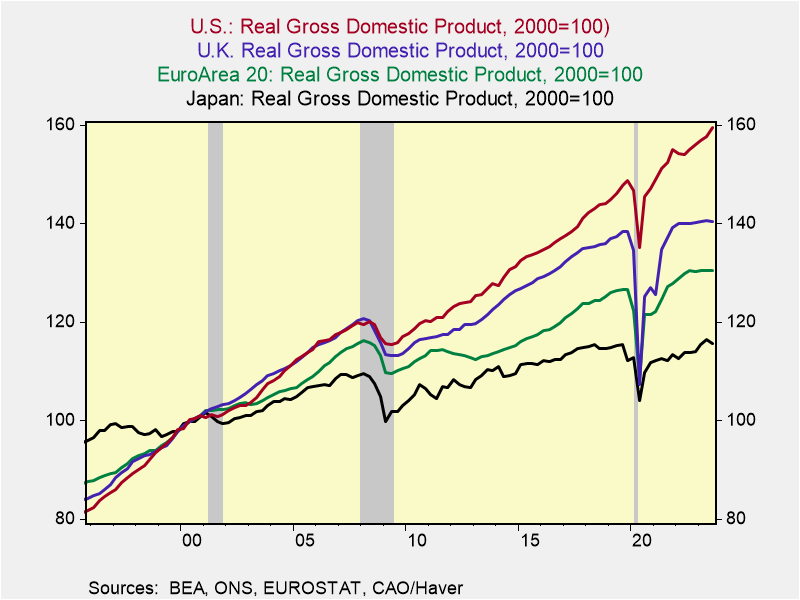
Estimates of U.S. potential growth have diminished over time: Estimates by the Federal Reserve and the Congressional Budget Office center on 1.8%. I am more optimistic about potential growth, based on an anticipated pickup in productivity gains driven by the U.S.’s world-leading innovations and entrepreneurship, and increases in the labor force that will be driven, in part, by increased immigration. Even with Japan’s healthy productivity, its diminished labor force has constrained its potential growth to an estimated 0.5%. Europe’s potential growth is now decidedly below 1%, with a wide variance across its nations. While growth prospects in Spain and southern EU nations have improved, Germany, Europe’s largest economy and its engine of growth though roughly 2017, has faltered badly, faces significant structural problems, and is now a drag on Europe’s economy overall. The UK’s potential is modestly below the U.S.’s but suffers from a lack of policy stability and purpose that undercuts confidence.
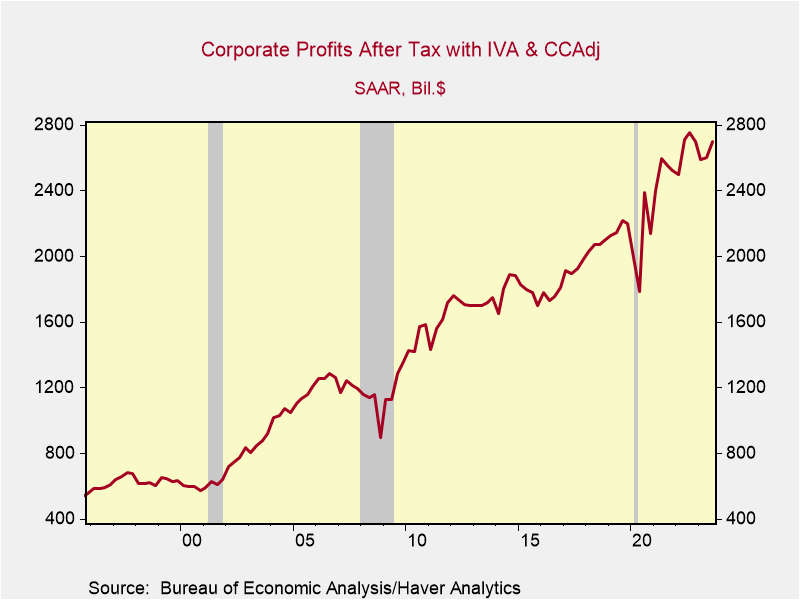
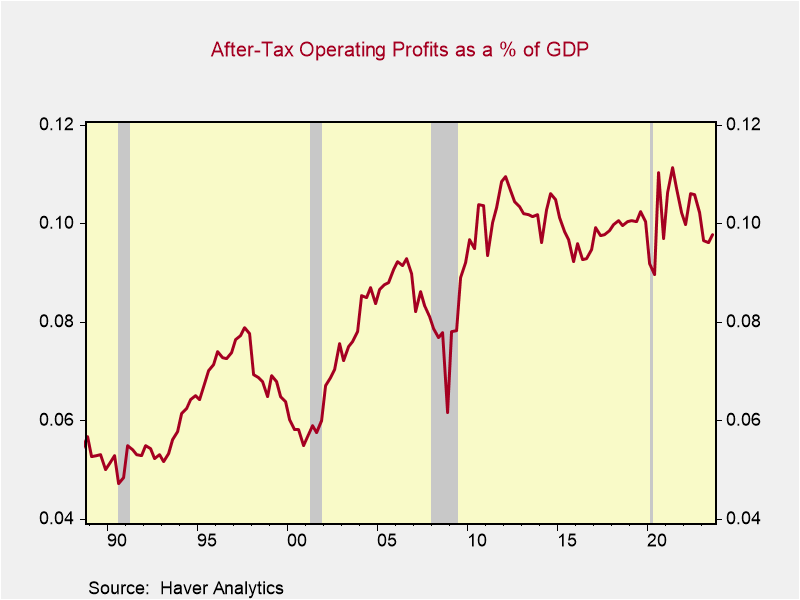
Comparisons across nations more problematic since the UK and EuroArea do not maintain data comparable to the U.S. or Japan. Chart 4 shows U.S. operating profits adjusted for inventory valuation and capital consumption allowances, indexed to 2000. Chart 5 shows after tax corporate operating profits as a percentage of GDP. They are high in historic terms but within their recent 10-year range. Based on corporate and profit data for S&P500 companies, U.S. profit growth is presumed to exceed those generated overseas. Of note, U.S. multi-national corporations generate repatriated profits from overseas activities that do not add to GDP, boosting the elasticity of profits relative to GDP. Presumably, Europe’s profits lag far behind, reflecting its slower economic growth, higher taxes and onerous regulations.
These relative trends in GDP, profits and stock markets, and the factors that drive them are embedded in expectations. Such high expectations reflect the optimism that the U.S.’s dominance in innovation and technological innovations and effective implementation into commerce will continue. They support the U.S.’s relatively high stock market valuations, independently of the discount rate of the future steam
Chart 4. U.S. Operating Profits Chart 5. Profits as a % of GDP
of earnings. Certainly, there are periods of outperformance of stocks in Japan, Europe, and the UK, but convergence of their stock price multiples with the U.S. should not be expected unless there is a convergence of expectations of economic growth or profits.
Profits in U.S. domestic industries have dominated net profits from overseas activities. The latter account for approximately one-sixth of total profits. Profits of U.S. nonfinancial industries have risen sharply since the pandemic, while profits in the private domestic financial sector have risen modestly. As shown in Chart 6, the Federal Reserve is now
Chart 6. Trends in Corporate Profits Chart 7. Trends in Nonfinancial Profits
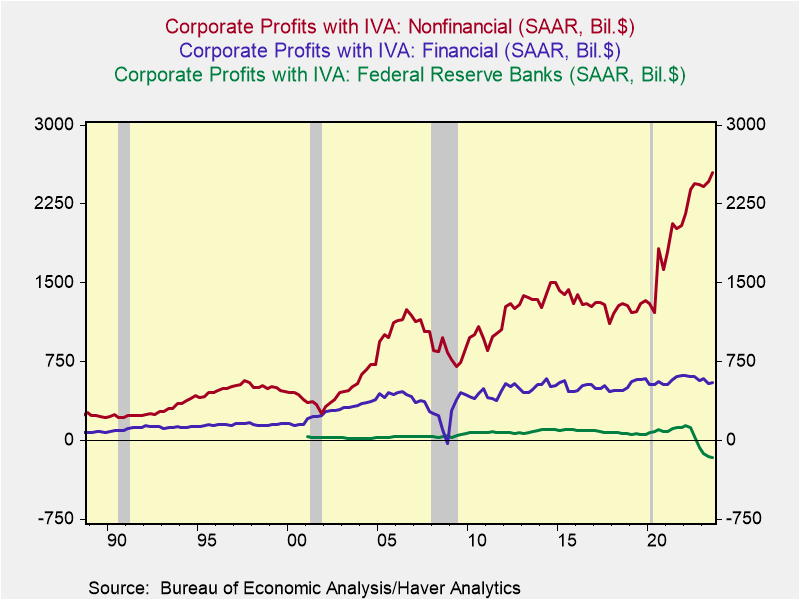
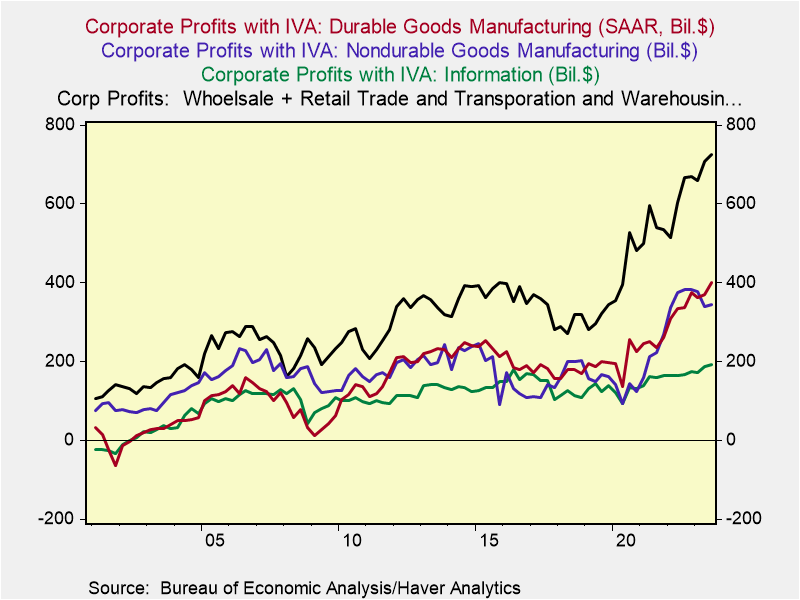
losing money, reflecting the adverse impact of higher interest rates on its bloated portfolio resulting from its massive asset purchases. Chart 7 shows the distribution of healthy profit gains across most nonfinancial industries. Profit gains in durable and nondurable goods manufacturing have been particularly strong since the pandemic.
Trends in U.S. GDP
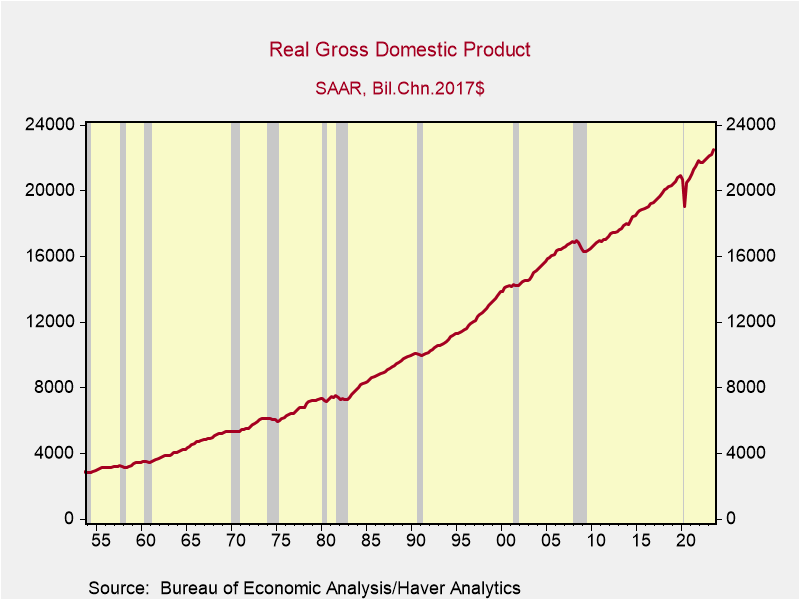
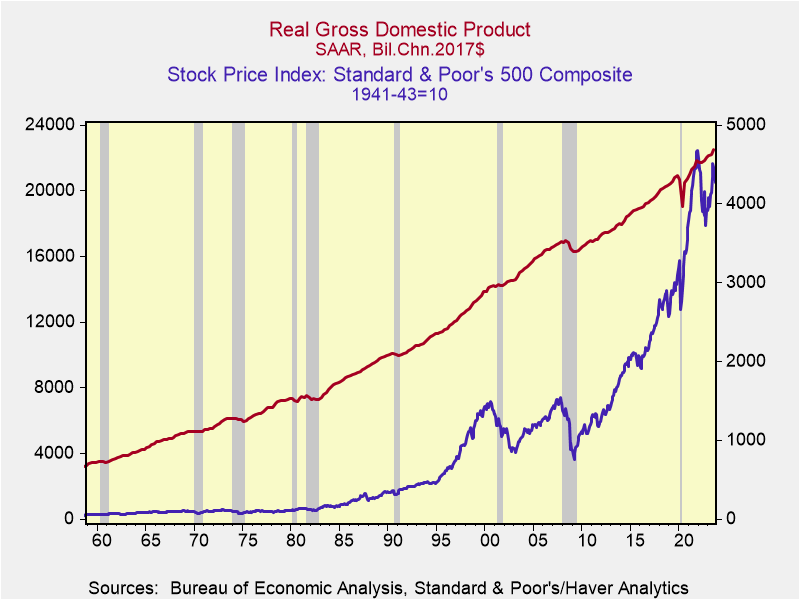
The longer-run trend of real GDP highlights its nearly persistent rise that is periodically interrupted by recession that with only a few exceptions — the mid-1970s, the Great Financial Crisis of 2008-2009, and the 2020 pandemic — seem rather minor (Chart 8). Of course, quarterly and yr/yr changes are much choppier and reveal the cyclical fluctuations in GDP that dominate financial market analysis and media coverage. But it’s the longer-term upward trend in real GDP that is the primary driver of economic progress and higher standards of living.
Chart 8. Longer-run Trend in Real GDP
Among the components of real GDP, several trends stand out. Consumption remains roughly 68% of GDP, close to a high, reflecting the rise in consumption of goods as a
percent of GDP and the modestly declining share of consumption of services. Goods consumption has been driven by spending on recreational goods and vehicles, particularly since the pandemic. The share of nondurables consumption has diminished over time, but has jumped since the pandemic. The declining share of consumption of services as a percent of GDP reflects falling real spending on financial services and insurance, reflecting narrower margins, along with flatter real consumption of housing and utilities.
Most strikingly, the share of nonresidential investment has risen dramatically — climbing to 14.5% from 9% in the 1990s and 12% during the 2010-2019 expansion. This reflects the surge in business investment spending on software and R&D. During the same period, investment in structures and industrial equipment has lagged the growth in real GDP. As described in earlier reports, the dramatic rise in business spending on software and R&D has been at the center of the innovation- and technology-driven growth of the economy, and has also served to dampen the cyclicality of the economy (Factors Supporting a Soft-Landing, December 10, 2023).
Residential investment, which includes new home construction and home improvements, peaked at 6.9% during the debt-financed housing bubble in 2007 and has diminished to 3.3%.
Exports have declined to 11.1% of real GDP, a modest decline from their average in 2010-2019, while imports have continued their rise, climbing to 15.2%. This has resulted in a widening of the real trade deficit to 4.1% of GDP, reflecting the extent to which domestic demand exceeds domestic production — and a widening current account deficit.
Government purchases — consumption and investment — that directly absorb national resources and are counted in GDP have gradually diminished over time, and now stand at 17.1%, down from 25% in the 1980s. At the same time, government deficit spending has continued to rise, reflecting the compounding increases in transfer payments, largely entitlement programs that provide income support. This involves the ongoing shift in the direction and purpose of government spending, allocating more resources toward income support and redistribution.
The biggest swing factor in government purchases as a percent of real GDP has been spending on national defense, which declined sharply in the 1990s from 7% of GDP to 4% and has drifted down to its current 3.7%. The recent increases in government investment in infrastructure spending on defense has contributed to real GDP growth (Fiscal Policy and the Fed Work at Cross Purposes, September 9, 2023).
Real GDP and its components convey critical information about trends in the economy and business environment. The upcoming GDP Report for 2023Q4 will not disappoint.
Trends Influencing 2024’s Economic and Political Landscape
Trends Influencing 2024’s Economic and Political Landscape
Along with the health of the U.S. consumer, four economic trends at the forefront of the political economy — the flattening of international trade, China’s economic slump, the decline in inflation amid continued rise in consumer prices, and the U.S. housing market — will influence the economic and political landscape in 2024.
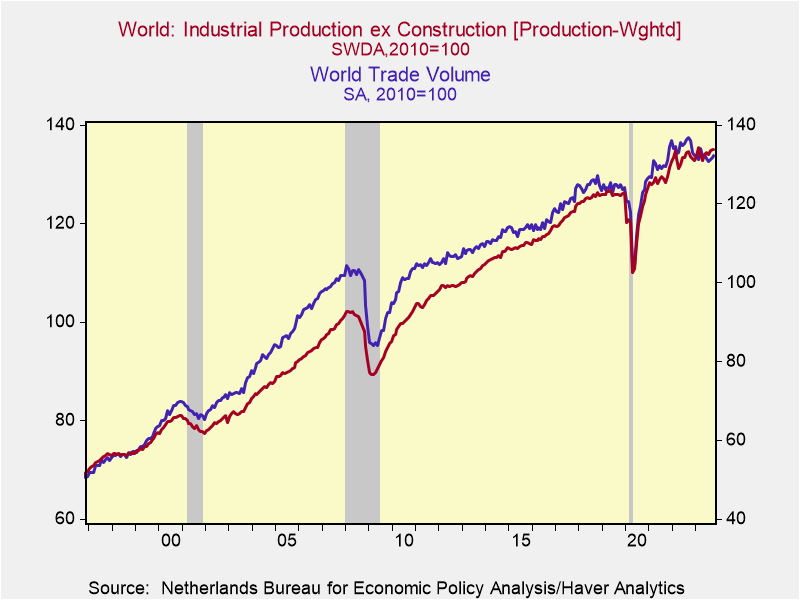
International trade. Global trade volumes have flattened, as nations are retreating into regional shells (including a rapidly growing trading bloc centered around China, Russia and Iran), global corporations are restructuring their supply chains (away from China) and facing higher costs of financing trade and global supply chains, and physical trade is being inhibited and threatened by military and terrorist attack. These trends are a negative for global growth and efficiencies (Chart 1).
Chart 1. Global Trade and Industrial Production
So far, the biggest brunt on international trade has been felt by the United Kingdom and Europe, where exports and imports are down significantly since before the pandemic. Japan has also been adversely affected by its large trade exposure with China. The U.S. is better situated (Chart 2): although it has smaller relative export exposure than the UK, Europe, Japan and other advanced economies as a percent of GDP, its exports have continued to grow. Fortunately, its two largest trading partners — Mexico and
Chart 2. International Comparisons of Exports
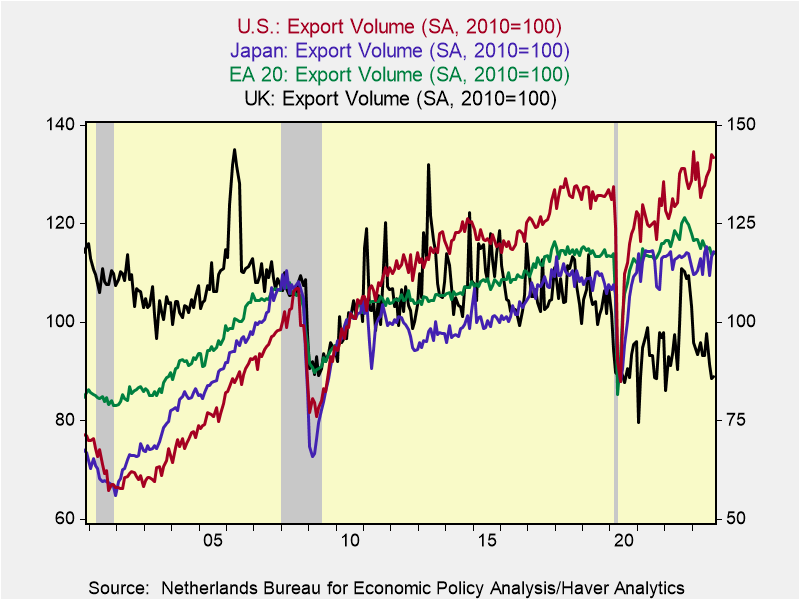
Canada — are also relatively insulated from China’s economic weakness and continue to grow. Mexico (and, to a lesser extent, other Latin American nations, including Brazil) is well positioned to benefit as it becomes an attractive center for production for global companies.
Nevertheless, the unwind and restructuring of global supply chains away from China is costly in terms of efficiency, and in the short run imposes economic costs that exceed any benefits stemming from onshoring of production and jobs. As James Manyika and Michael Spence state in “The Coming AI Economic Revolution” (Foreign Affairs, November/December 2023): “The era of building global supply chains entirely on the basis of efficiency and comparative advantage has clearly come to a close.” Moreover, the distortions and geopolitical risks stemming from the Russia-Ukraine war and war in the Middle East are raising the costs of trade and suppressing international trade, at least temporarily. Moreover, a concern looms: the weakness and disruptions to international trade may be significantly accentuated if Donald Trump were to be elected president and impose tariffs and barriers to trade, as he has promised to do.
China. China’s deflation — its yr/yr consumer price index has fallen for three consecutive months — is a direct consequence of insufficient aggregate demand and economic slump. Don’t look for any positive economic turnaround in 2024 in China, and take the official data published by China’s National Bureau of Statistics with a big grain of salt. The Chinese government is trying to stabilize home values and expectations, lift confidence, and encourage consumer spending. China’s official data put real GDP growth at 5% but a more realistic assessment is closer to 1½% (see Rhodium Group, “Through the Looking Glass: China’s 2023 GDP and the Year Ahead”, December 29, 2023). Such growth is not sufficient to maintain employment and wages. The deflation adds to the lack of confidence and social unrest, particularly among China’s youth that must adjust down expectations about their future. That’s the cost of a Communist dictatorship.
As described in earlier papers (“China’s Bill Comes Due,” September 19, 2023), President Xi’s clampdown on U.S.-style free enterprise has undercut innovation and productivity while the gross misallocations of resources that culminated in unsustainable excesses in real estate as Chinese leaders attempted to maintain unrealistically high levels of GDP growth have unraveled. The collapse in the government-generated excesses in real estate has generated sizable losses in household net worth and generated a sizable hole in local government finances. The former has dampened consumer spending while the latter has severely undercut local government finances and constrained China’s ability to finance fiscal stimulus. Similar with Japan’s asset price bubble in the late 1980s and the U.S.’s debt-financed housing bubble in the early 2000s, the adverse consequences for China’s consumers and domestic demand will be felt for years.
At the same time, global demand for China’s goods and production have been slowed by economic weakness in Europe and the UK and select emerging nations, along with efforts of global companies and advanced nations to reduce supply chain exposure to China. This reduces jobs in China’s export-related manufacturing industries. These negatives have been mitigated by China’s booming production and exports of EVs and strong gains in exports to Russia, Iran and the Middle East. The building of this new axis of trade has been a distinct positive for China, but not nearly enough to offset the weakness in trade with advanced economies.
In summary, China is no longer the engine of global growth and world economies must adjust.
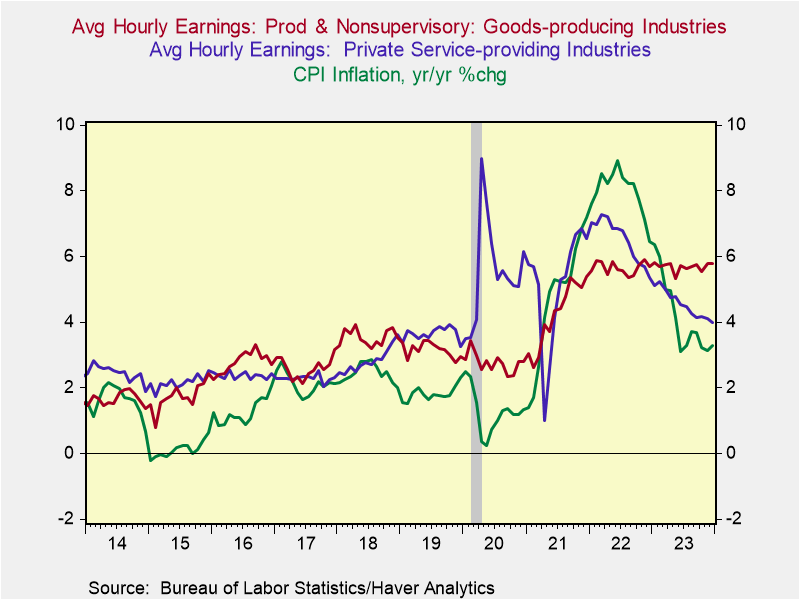
Disinflation but higher prices. The decline in inflation — measured yr/yr, CPI inflation has receded to 3.3% and 4.0% excluding food and energy (3.3% and 3.2% annualized in the last six months) — has resulted in an increase in real (inflation-adjusted) wages and purchasing power. Real average hourly earnings rose 1.0% in the year ending December 2023, retracing one-half of the decline in 2021-2022. And recent declines in energy prices have boosted purchasing power (Chart 3).
Chart 3. Average Hourly Earnings and Inflation
The lower inflation is a distinct positive for consumers and economic performance. On the other hand, prices of goods and services continue to rise, and following the 2021-2023 surge in inflation, they are dramatically higher than pre-pandemic levels. These price increases have impinged on standards of living for households and the price sticker shock is resonating in election year politics.
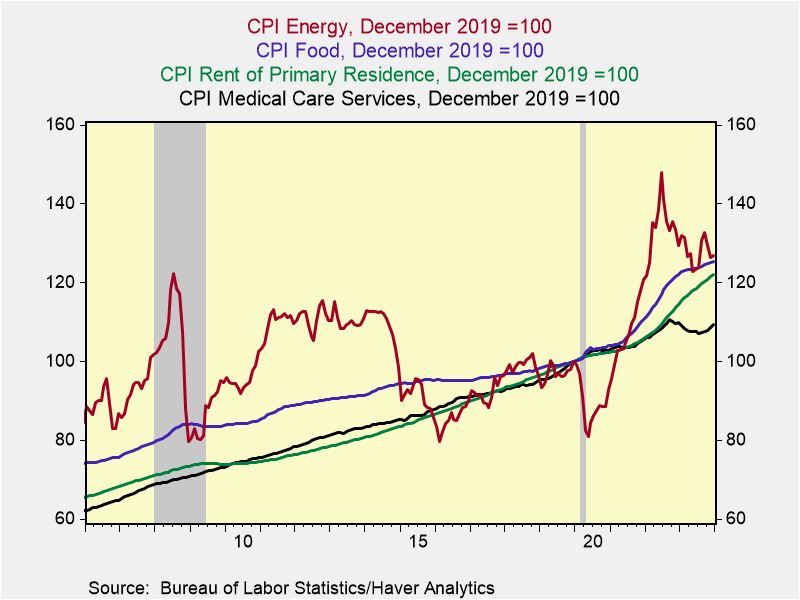
Since before the pandemic (December 2019), prices of food have risen 25.4%, rental costs are up 21.9% and even with the simmering down of energy costs, energy prices are up 26.9%. Of note, the large laggard in price increases has been health care costs that are up only 9.3% since late 2019 (Chart 4). One factor underlying this subdued price increase may be the government’s efforts to constrain budget outlays for Medicare, Medicaid, and other subsidized health care that has involved squeezing reimbursable schedules. This would affect the price changes recorded for an array of medical care services. (Note the CPI measures price changes of out-of-pocket consumer expenditures, while PCE inflation measures price changes of total consumer expenditures including those paid for by Medicare, Medicaid and corporate health care insurance.)
Chart 4. Price Increases since Before the Pandemic
The Fed’s stated mandate is 2% average longer-run inflation, and the objective of its strategic plan is to let bygones be bygones, with no intention of a makeup strategy that would offset the 2021-2022 surge in inflation.
The higher prices are having the largest impact on lower- and middle-income households who are renters and face dramatically higher costs of living but have not benefited from home ownership or the stock market appreciation. The resulting impacts on real incomes and wealth of households with different social and demographic characteristics may influence perceptions and affect election outcomes.
U.S. Housing. New and existing home sales and construction have been constrained by insufficient supply and the sharp rise in mortgage rates through October 2023. The constraints on supply of existing homes stemming from low mortgage rate lock-ins has only compounded the shortfall in the housing stock that accumulated during the 2010-2019 expansion when new unit construction was persistently below the growth in demand associated with new family formation. These imbalances have contributed to stubbornly high home prices and decades-low home affordability index. Meanwhile, healthy labor mobility continues to support housing demand in medium and smaller-sized cities.
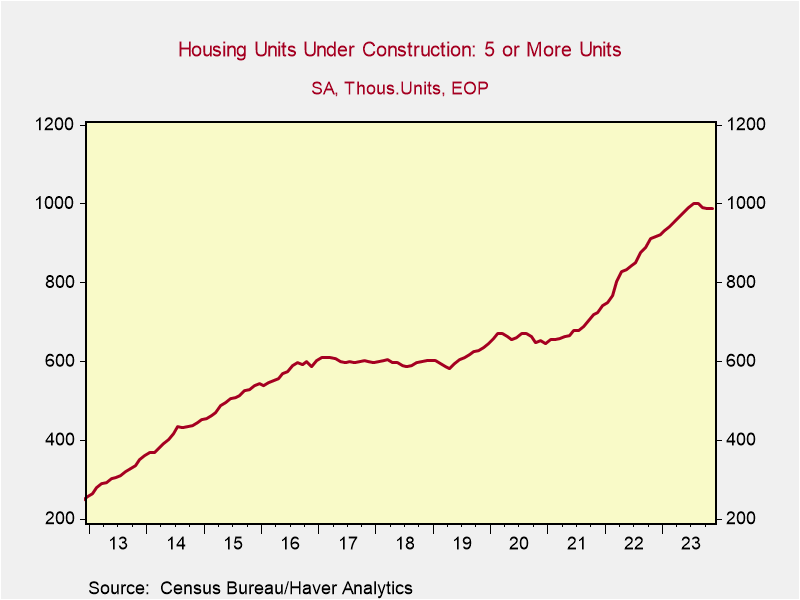
Relief may be coming: the recent sizable decline in mortgage rates has improved home affordability and will increase demand, and, according to the U.S. Census Bureau, the number of completions of apartments that will come on the market in 2024 will be 50% higher than the record-breaking 444,000 in 2023 (Chart 5). These increases in supply and demand along with lower mortgage rates are expected to increase sales while providing some relief on prices. Not surprisingly, contractors are expecting a strong homebuilding season in Spring 2024.
Chart 5. Multi-Family Housing Units under Construction
As described in recent briefs, these positive factors of disinflation and housing are expected to support continued economic expansion in the U.S., while the impacts stemming from constraints on international trade and China’s ongoing economic woes are negatives and require scrutiny.
The Stock Market and Economic Performance during Presidential Election Years
How will stocks fare and what will happen to interest rates during this Presidential election year? These questions are viewed through three lenses: 1) a historical assessment of economic and financial performance during Presidential election years going back to 1960, including the performance of the S&P500 during Presidential election years, along with changes in the Federal funds rate, inflation, real GDP, employment and the unemployment rate as highlighted in the table below, 2) recent research on Federal Reserve behavior during election years, and 3) prior research on the cyclical linkages between the S&P500, corporate profits and economic expansions.
In summary,
*The stock market tends to appreciate during Presidential election years as long as the economy is expanding, regardless of whether the Fed is raising or lowering rates, and
*The Fed responds to inflation and the economy and labor market conditions in the same manner during Presidential election years as during off-election years; also of note
*Incumbent party Presidential candidates tend not to be re-elected when election years involve recessions.
Thus, financial market outcomes in 2024 depend critically on whether the economy continues to expand. Continued economic expansion in 2024, as I project, would support stock appreciation. Of course, international conflicts, turmoil surrounding the Presidential election and other risks must be taken under consideration. As long as economic growth doesn’t accelerate materially above longer-run potential and inflation stays at current levels or below, the Fed will lower rates. Obviously, economic performance will heavily influence the election.
Column 1 in the table below shows the percentage change in the S&P500 during every Presidential election year since 1960, measured from December of the prior year to December of the election year. Election years that involved recession are designated with an (R) and those when the incumbent party candidate was elected are designated with an (*). The other columns show election year economic trends (real GDP, employment and the unemployment rate, Columns 4 and 5), inflation (Column 3) and the Federal funds rate (Column 2).
Stocks have tended to rise during election years, with the primary exception when the economy was in recession: in 1960 (the NBER designated a recession from April 1960-February 1961), 2008 during the Great Financial Crisis, and 2000 (following the dot.com bubble and in anticipation of the 2001 recession). The S&P500 was virtually flat during the 1984 Presidential election year (December 1983-December 1984) following a 50% rise from its August 1982 trough. In 2020, stocks rebounded sharply and registered healthy yr/yr gains following the sharp Covid recession and stock market contraction in the first half of the year. In most other election years, the S&P500 registered double-digit gains, even when they followed healthy gains in prior years.
The focus of an earlier report on the cyclical behavior of corporate operating profits and the S&P500 (“U.S. Stock Market and Economy: Room to Rise”, June 2022) provided a key finding that is relevant to current observations. It found that while operating profits always peaked mid-expansion cycle, the S&P500 continued to rise as long as real GDP expanded and peaked at or just prior to the onset of recession. This underlines the importance of the economy in supporting the stock market.
A comparison of the S&P500 and the Fed funds rate in Columns 1 and 2 suggest that during most Presidential election years when the economy was expanding, the S&P500 tended to appreciate regardless of whether the Fed was raising or lowering rates. In those years, the direction of change of interest rates did not materially influence election outcomes.
Regarding Federal Reserve behavior during election years, my research has shown that the Fed has conducted monetary policy during election years in a manner similar to off-election years, with only one (1972) exception. The Fed’s tendency has been to adjust the Federal funds rate in response to deviations of the unemployment rate and inflation from the Fed’s central tendency forecasts. When the unemployment rate rises (falls) outside the range of the Fed’s CTFs, the Fed lowers (raises) rates, and it raises (lowers) rates when inflation rises above (falls below) the CFT. My empirical research shows that this Federal Reserve reaction function holds during presidential election years (“The Fed Won’t Try to Boost Biden”, Wall Street Journal, December 26, 2023; the title of the manuscript I submitted was more appropriate: “The Fed Lies Low in Election Year Politics”)
The Fed has already sharply cut its 2024 projections of core PCE inflation for Q4/Q4 (CTF, 2.4%-2.7%) and is projecting a modest rise in the unemployment rate from its current 3.7% to 4.1% in 2024Q4; CTF 4.0%-4.2%). While the Fed has announced its intention to cut rates in 2024, the CTFs suggest a high hurdle for doing so. However, the Fed’s reaction function must be considered within the current context in which the real Fed funds rate has risen to 2.2 percentage points, resulting in a rise in the Fed’s policy rate target to 5.25%-5.5% and a decline in core yr/yr inflation to 3.2%. Despite the Fed’s ongoing efforts to estimate the natural rate of interest (r*) consistent with achieving its dual mandate (2% inflation and maximum employment), uncertainty abounds. The bottom line is the Fed’s policy deliberations will be particularly data dependent, and considered independently of the of the highly charged presidential election campaign.
Stock Market and Economic Performance during Presidential Election Years
 Sources: Standard & Poor’s, Federal Reserve Board, Bureau of Labor Statistics, Bureau of Economic Analysis/Haver Analytics
Notes: R indicates that a recession occurred during the year; * indicates incumbent party candidate is elected; yr/yr percent change and percentage point changes are measured December of prior year to December of the election year; **Empl is establishment payrolls and UR is the unemployment rate.
Chart 1.
Critical Issues for U.S. Economic and Financial Performance in 2024
The lead stories in 2023 were the resilience of the U.S. consumer and the economy that dispelled concerns about recession and lifted expectations about sustained growth; a decline in headline and core inflation that reduced inflationary expectations, despite the damages of stemming from the high level of prices; and the Federal Reserve’s associated shift from higher-for-longer forward guidance to signaling that it will lower interest rates in 2024, which powered a late-year significant decline in yields.
The big economic issues in 2024:
- Will the economy merely simmer down or fall into a mild recession, and how will the Fed respond to the data in real time? The highest probability is a soft-landing or a recession that is sufficiently mild, with temporary fractional decline in activity and only modest rise in unemployment, such that the upward trajectory of growth is barely interrupted.
- Consumption and employment are important, but so is housing, which is expected to get a bounce from the recent decline in mortgages. Moreover, ongoing increases in government purchases will continue to boost growth and stimulate private business investment.
- Any back up in inflation, even if temporary, would surprise both the Fed and the markets, with adverse consequences.
- The Presidential election and its policy implications loom large, but this brief does not address the political polls or speculation on the outcome.
- Although Russia’s aggressions against Ukraine and the Hamas-Israel war in 2023 did not material affect financial markets, these are critically important issues that may affect economic and financial performance in 2024.
Employment and Consumption Issues. Growth in employment and consumption remained healthy through November. Payroll gains in October-November were a touch lower than its average monthly gain over the last five months (175,000 vs 200,000) while real consumption simmered down following its unsustainable 3.1% annualized growth in 2023Q3, and is on track for 2% annualized growth in Q4 (Charts 1 and 2). Both employment and consumer spending are expected to slow materially in early 2024, but not fall for any sustained period. Such a natural adjustment would not be jarring.
Businesses have managed their operations efficiently, avoiding excesses in employment and inventories, and have record-breaking cash on hand. While employment gains are expected to simmer, large cuts are unnecessary. Consumption is being driven by the strong rise in real disposable personal income (up 4.25% yr/yr), which is getting a boost from the lower energy costs and headline inflation. Moderating job gains will dampen the pace of growth while lower costs of borrowing are expected to lift sales. On average, household balance sheets are solid, with high and rising household net worth lifting the propensity to consume (“Consumption and Household Net Worth,” December 21, 2023).
Amid these positives, pockets of stresses are clearly emerging, with marked increases in delinquencies on servicing debt on auto and credit card loans, despite low unemployment and few job layoffs. This deserves scrutiny. However, 65% of consumption is consumption of services, whose growth tends to be quite stable, in part because measurement of its two largest components—costs of shelter and health care—are imputed. Not to understate the financial stresses facing the underemployed and lower- and middle-income earners, their spending constitutes a relatively small portion of total discretionary spending and consumption, and banks are adequately capitalized to write off nonperforming consumer loans.
As 2024 unfolds, important data releases will set the tone for the highly data dependent Fed and financial markets. Auto sales during December will be released Wednesday January 3. Most importantly, the December Employment Report will be released Friday. The risk is weaker-than-expected (consensus, +170,000) job gains: November’s 199,000 increase was lifted by the return to work of 30,000 UAW workers and 50,000 government job gains; the employment index in the November ISM manufacturing was weak (45.8) and the ISM for services was soft (50.3); and large distribution companies indicated that they added fewer seasonal employees than in either 2021 or 2022.
Housing sales were constrained in 2023 by insufficient supply (particularly of existing homes due to low mortgage rate lock ins), the rise in mortgage rates to 8.2% through late October and the low affordability. In November, existing home sales fell to a 3.82 million annualized pace, down 40 percent from late 2021 highs and close to the depressed lows recorded in 2010 following Great Financial Crisis, while new home sales were 14% below their 2019 average (Chart 3). The sharp decline in the 30-year conventional mortgage rate to 7% from 8.2% in late October is expected to loosen up supply and demand for housing and increase sales. Housing punches above its weight in GDP, adding to construction employment and consumption of household durables.
Business Investment and Government fiscal stimulus. Of note, despite ongoing woes in commercial real estate in large cities and lackluster business investment in equipment (highlighted by declines in information processing and industrial equipment), business investment in structures has risen dramatically, by 15.7% since 2022Q3. This reflects strong business responses to the government’s 25% tax credit for building facilities to manufacture computer chips, batteries and green-related equipment through the CHIPS Act and other government subsidies. Based on the projects underway, and the government’s array of tax credits and subsidies of the Inflation Reduction Act, business investment in structures is likely to continue in 2024.
In addition, business investment in software for developing technological innovations and improving efficiency in businesses in a wide array of sectors continues to soar. It has risen 42.4% in the last three years through 2023Q3 and is expected to continue rising in absolute terms and as a percent of total business fixed investment.
In addition to its incentives that stimulate private sector investment, government purchases—consumption and investments that absorb national resources--continue to rise rapidly. These purchases add directly to GDP and generate jobs in both the public and private sector. In the four quarters ending 2023Q4, a 4.8% rise in real government purchases constituted 27.6% of the 2.9% rise in real GDP. Government purchases include spending on the $1.2 trillion American Infrastructure and Jobs Act if 2021 and increases in Federal spending for defense and national security (it does not include transfer payments; see “Fiscal Policy and the Fed Work at Cross Purposes”, August 9, 2023). The heightened demand for defense spending and the Biden Administration’s political incentives in the Presidential election year suggest that rising government purchases will support GDP growth and jobs in 2024.
Inflation. Core PCE inflation has fallen significantly in the last year, from 5.1% to 3.2% in November. It is likely to recede further through 2024Q1, reflecting a further ebbing of shelter inflation that is driven by the lagged impact of the Case Shiller home Price Index on rental costs and OER, and the favorable base adjustment from the monthly increases in December 2022-March 2023 that averaged 0.4%.
The Fed has forecast core PCE inflation will reach 2.4% by 2024Q4, which would require a significant slowdown in aggregate demand and nominal GDP growth. Nominal growth is estimated to have slowed in Q4, following its 8.3% annualized surge in Q3, but a further deceleration would be required in 2024. Importantly, in past cyclical episodes in which nominal GDP decelerated sharply, the largest initial impact was on real GDP while inflation responded with a lag. Not so this episode, in which the sharp deceleration in nominal GDP has had its biggest impact on inflation, while real GDP has held up. Cutting inflation substantially further without denting the economy will be more problematic.
The Fed’s inflation forecast for 2024Q4 seems a stretch and financial markets have seemingly bought into this favorable assessment. Any backup in inflation, even if temporary, would be a negative surprise.
The Fed. Several weeks before Fed Chair Powell’s signaled at the press conference following its December FOMC meeting that the Fed would likely begin lowering rates in 2024, Governor Chris Waller stated that if inflation stayed low, the Fed would lower rates to align with the lower inflation. This was a critical point: as inflation has declined, the Fed’s real policy rate has increased (Chart 5). Along with continued declines in M2, this rise in real rates is consistent with restrictive monetary policy. While the Fed wants to continue pursuing a policy consistent with its 2% inflation objective, at least as long as the economy and labor markets perform adequately, it doesn’t want to become inadvertently too tight. In knows that its credibility hinges on both lower inflation and avoiding recession. History shows clearly the Fed responds more aggressively to rising unemployment than it does to rising inflation.
Of note, if the economy continues to show resilience and grow close to estimated potential, even with the Fed funds rate at 5.25%-5.5%, the Fed will likely revise up its estimate of the natural rate of interest (r*), indicating a higher real Fed funds rate is appropriate to achieve its inflation objective. This would signal less aggressive rate cuts.
In real time, the Fed’s decisions will be data dependent. Look for the Fed to begin cutting rates in late spring, but if the economy continues to grow close to its potential path and the unemployment rate remains below its estimated natural rate (which he Fed estimates to be 4.1%, the Fed will not lower rates as the futures markets currently expect.
The Presidential election. Steering clear of speculation about unanticipated turns of events, traditional economic models that estimate the probability of election outcomes rely on the levels and trajectories of employment and the unemployment rate, real disposable personal income and inflation. Currently, the trends favor President Biden’s re-election: real disposable personal income and employment are rising and the unemployment rate is low, and inflation is receding. However, one glaring negative among domestic issues is that while inflation is receding, opinion polls indicate the dramatic rise in the level of prices of goods and services generated by the surge in inflation since early 2021 is cutting into Biden’s support (Chart 6; “We’re Still Paying for the Federal Reserve’s Blunders,” Wall Street Journal, October 26, 2023.)
Finally, the Fed is expected to lie low this election year. That would involve lowering interest rates in response to the softer economic growth and receding inflation, in line with its typical reaction function. This is based on my research of the Fed’s conduct of monetary policy during presidential election years, which shows that with one glaring exception in 1972, the Fed adjusts its interest rates in response to unemployment and inflation conditions during election years in much the same manner as it does during off-election years (“The Fed Won’t Try to Boost Biden,” Wall Street Journal, December 26, 2023).
Chart 1. Nonfarm Establishment Payrolls
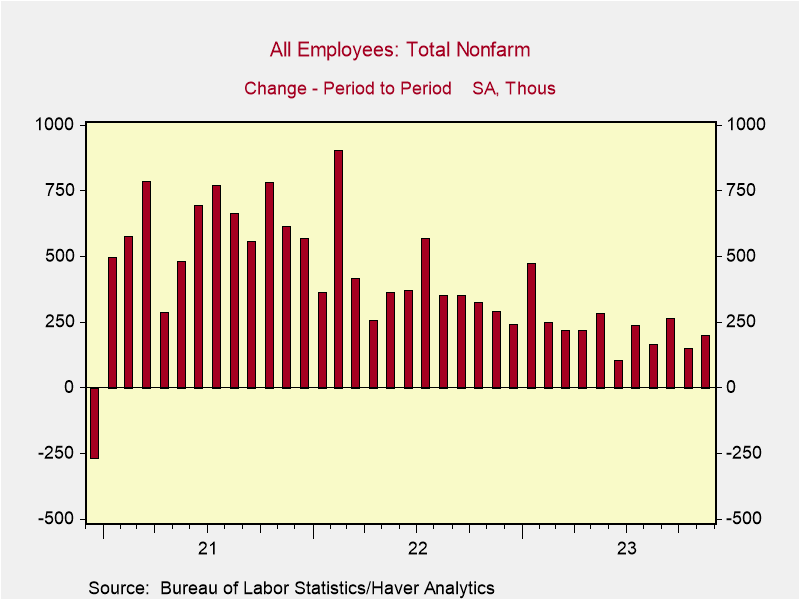
Chart 2. Real Disposable Income and Consumption
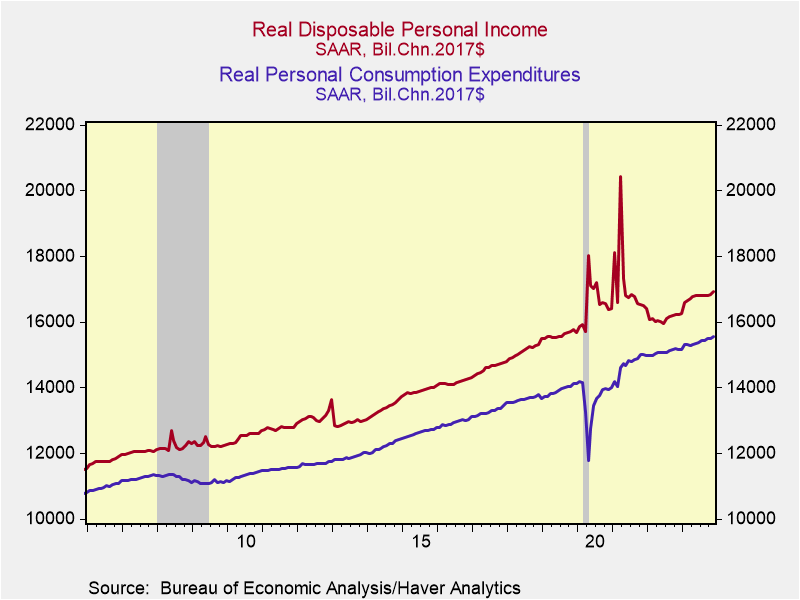
Chart 3. Existing and New Home Sales
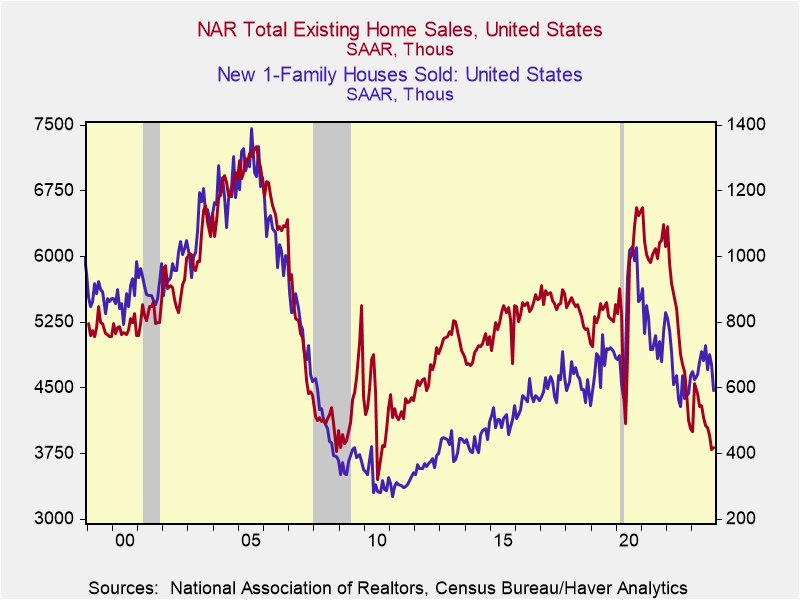
Chart 4. Business Investment in Software and Structures
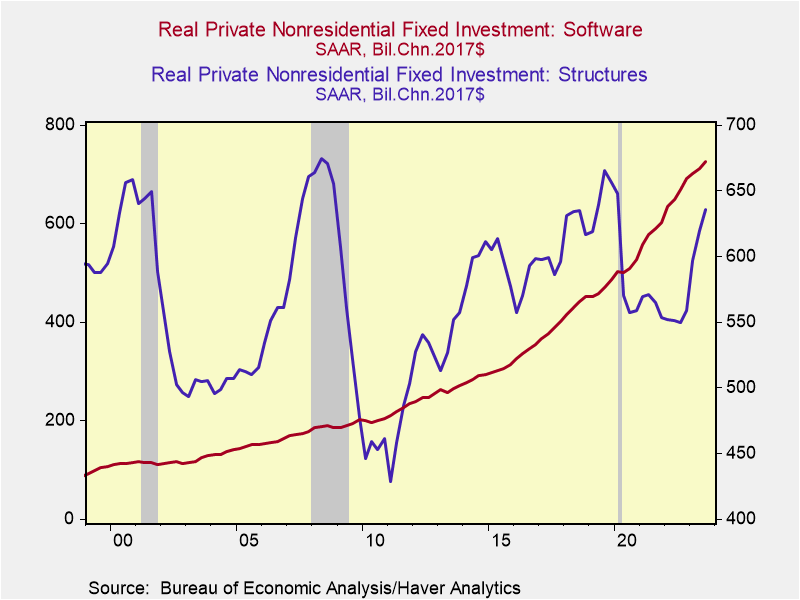
Chart 5. The Federal Funds Rate and Inflation
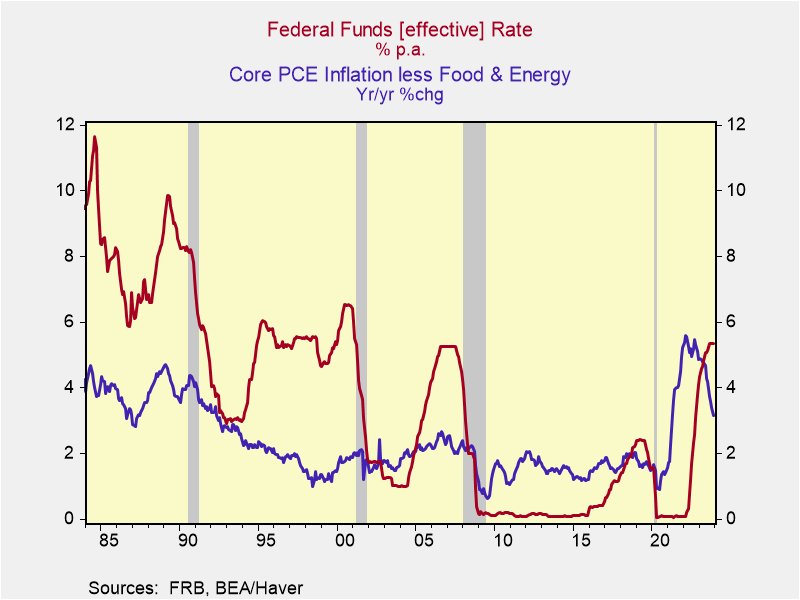
Chart 6. PCE Disinflation but Higher Prices
