
Consumption and Household Net Worth
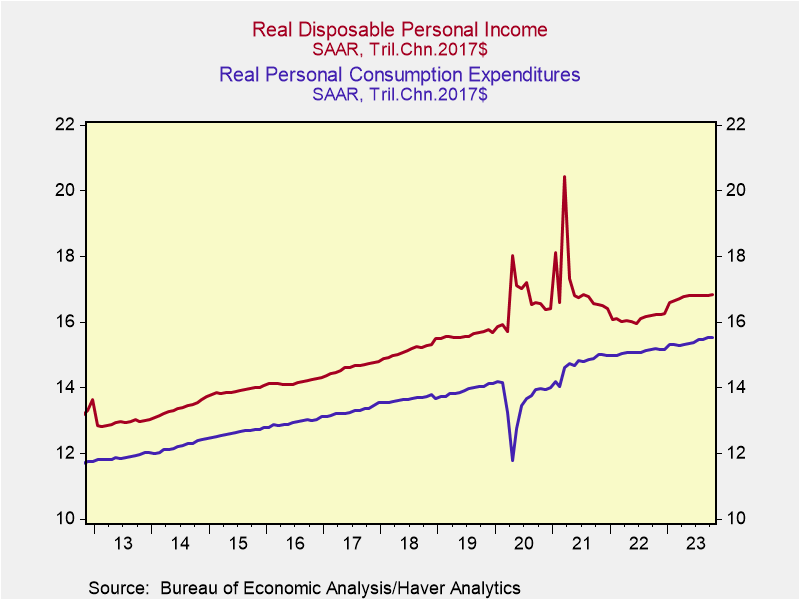
The sustainability of the expansion and the health of the economy depends critically on consumption, which is 69% of GDP. The biggest factor driving consumption is real disposable income, which is determined by employment and wages, but it is also influenced by real interest rates and changes in household net worth. This note briefly discusses the trends in disposable income, interest rates and consumption and then focuses on household net worth and its implications.
Employment and consumption are closely correlated, with causality in both directions: businesses hire when product demand is rising, which supports personal income and spending, and they cut jobs when product demand softens. Continued job gains are highly important for the consumption outlook. A sizable portion of the population spends most of its disposable income, with the rate of personal saving now hovering around 4%.
Establishment payrolls gains slowed in recent months, and are expected to moderate further. November’s 199,000 rise in payrolls was boosted by return of 30,000 UAW workers following their strike and a 50,000 increase in government employment. Job openings and the quit rate receded back to pre-pandemic levels, reflecting the slower demand for labor and increasing worker concerns and caution. Weaker gains in employment would moderate increases in disposable personal income, which is up 3.75% yr/yr. Even as businesses continue to restructure, job layoffs have remained low. Meanwhile, employment in the Household Survey is rising faster (2.2% yr/yr) than payrolls in the Establishment Survey, perhaps reflecting the heightened mobility of labor and the expanding roll of self-employed people.
While the rise in real interest rates since 2021 has dampened consumption, the rise in household net worth has provided a valuable offset. Among the interest sensitive sectors, auto sales have held up better than expected despite significant increases in borrowing costs, while housing activity has dampened.
Motor vehicle sales have remained above a 15 million annualized pace for much of 2023, above their 14 million pace in 2022, even though the average borrowing costs reached 7.8% and over 80% of sales of new autos are debt-financed. The higher mortgage rates have weakened housing activity, slowing employment in construction and consumption of household durables. The recent significant decline in interest rates is expected to provide support to debt-financed consumption and housing demand. The rise in household net worth, particularly soaring home values, has increased the propensity to spend and has provided a valuable offset.
The savings cushion: important but not the whole story. The savings cushion, which has received substantial attention, is the cumulation of the rate of personal saving—the portion of disposable personal income that is not been spent. The dramatic spikes in the rate of personal saving in 2020-2021 resulted from the government’s overly generous income support responses to the pandemic while mandated shutdowns constrained spending. This bloated the cash-flow savings cushion to an estimated $2.5 trillion in 2020-2021, over 12% of disposable income. Chart 1 shows the spikes in disposable personal income were closely related to the direct transfers to individuals through the CARES Act in March 2020, the Tax Relief Act in December 2020 and the American Rescue Plan in March 2021.
As rising inflation cut into real purchasing power, consumers spent a portion of this cushion in 2021-2022, which along with ongoing healthy growth of real disposable income contributed to sustained growth of real spending. A key focus of Wall Street economists and commentators in 2023 has been estimating the remaining savings cushion and speculating on what would happen to consumption when the cushion dissipated. This led many to take a pessimistic view of consumption.
The savings cushion is largely held in liquid assets such as bank deposits and short-term money market funds and is an important source of financing spending. However, focus on the savings cushion has diverted attention from household net worth--its dramatic increases and sheer magnitude—that has a sizable impact on consumption.
Household net worth. Household net worth, published by the Federal Reserve Board, includes the value of financial assets such as stocks and bonds and liquid assets, as well as pensions, annuities and other forms of savings, and nonfinancial assets, largely residential real estate. Since just before the pandemic in 2019Q4, it has soared by $34.1 trillion, or 29.6%, in 2023Q3 (Chart 2). It is 7.75 times the annualized flow of disposable personal income. It has continued to rise in Q4, driven by the rally in stocks, decline in bond yields that has pushed up the principal value of bonds, and particularly by the ongoing rise in residential real estate values.
Household net worth is less accessible than the largely liquid savings cushion, but is magnitudes larger and financial innovations have facilitated easy and efficient avenues for extracting cash out of assets. Borrowing against real estate wealth is readily available and does not involve negative tax consequences.
A summary of important details from the FRB’s Household Net Worth data is provided in Table 1. From 2019Q4 to 2023Q3, total household assets have increased 28.1% to $171.3 trillion from $133.5 trillion, while total outstanding debt has increased 22.3% to $20.3 trillion from $16.6 trillion. The slower growth in household debt reflects in part lower interest rates that have reduced debt service costs. Financial assets have increased 20.1% to $112.4 trillion from $93.6 trillion. Importantly, the value of real estate has soared 52.2% to $45.5 trillion from $29.9 trillion while outstanding residential mortgages has increased 22.9% to $12.9 trillion from $10.5 trillion. As a result, owners’ equity in residential real estate net of mortgage debt has risen 68% to $33.6 trillion from $19.4 trillion since 2019Q4.
While the distribution of household net worth is highly unequal, with 66% of the net wealth held by the top 10% of households, and in general skewed toward households with high income, tend to be older and have higher educational attainment, there is a surprisingly large number of households with significant wealth. According to the United States Census Bureau’s Survey of Income and Program Participation (SIPP) for 2021, while the 50th percentile household had net worth of $166,900, the 75th percentile household had net wealth of $604,900, and the 90th percentile has net wealth of $1,623,000.
Based on 130 million households, these data suggest that in 2021 approximately 15 million households had net worth exceeding $1 million. The appreciation of asset values, particularly residential real estate, has lifted these figures significantly through 2023, as shown in the Fed’s latest Survey of Consumer Finances.
Wealth and the economy. Household net worth affects the economy through direct flows into disposable income and the economy and by changing the propensity to spend. A portion of the wealth flows directly into disposable personal income. Assets of pension funds, annuities and IRAs are distributed and redeemed, adding directly to disposable personal income. Currently there are $13 trillion in IRAs, 401(k)s and Keoghs, and people over 72 must redeem minimal amounts each year. Pensions and annuities provide a constant stream of income to retirees.
Charitable giving in 2022 was $500 billion and sizably larger in 2023, which boosts the spending and activities of charitable organizations. Intergenerational gifts within families transfer wealth to family members and increase purchasing power. Direct cash gifts up to legal limits increase spending power of recipients. Parents provide down payments to their grown children to subsidize rental costs and first home purchases, while grandparents pay for the educational costs of their grandchildren, freeing up purchasing power of the parents. These and many other avenues lift consumption and economic activity.
In addition, increases in household net worth lift the propensity to spend disposable income. Most empirical studies, many conducted in the early-2000s, have found that changes in household net worth influence the propensity to spend, with the estimated elasticity of consumption with respect to changes in wealth centering around 0.05. Key studies have found that changes in real estate values have a significantly larger impact on spending than increases in the value of financial assets such as stocks and bonds (Greenspan and Kennedy 2007). The presumption was that increases in residential real estate were considered more permanent than increases in the value of financial assets like the stock market, and that it’s easy to extract cash from real estate assets without the potential tax costs of selling stocks or bonds or redeeming money from IRAs or pensions.
A more recent paper by Karl Case, John Quigley and Robert Shiller (of the Case Shiller Home Price Index fame) published in 2013 is particularly instructive because its estimates of the wealth effect include the impacts of the sharp decline in home values around the Financial Crisis as well as their surge in the early 2000s (Case, Quigley and Shiller 2013). Based on regional and state-by-state data and using retail sales as a proxy for consumption, they estimated an elasticity of retail sales with respect to a change in real estate values (net of debt) of 0.066-0.068. This was higher than their earlier estimates conducted before the Financial Crisis. Like other studies, they found changes in the value of financial assets to have a lesser effect on retail sales, approximately .025. Of note, while their earlier study found an asymmetric wealth effect in which rising home values boosted consumption but falling home values did not, this study found a symmetrical wealth effect.
These estimates may overstate the wealth effect on consumption, since retail sales are 35% of total consumption and include a higher share of discretionary spending than consumption of services (65% of consumption), which includes spending on shelter, health care, personal and business services and involve less discretionary spending.
Nevertheless, their estimates of the wealth effect explain the very weak rebound in consumption following the financial crisis. The fiscal stimulus provided by the American Recovery and Reinvestment Act of 2009 and the Fed’s imposing zero interest rates and its series of quantitative easing programs were mitigated by the negative wealth effect imposed by the 25% decline in residential real estate values from 2006Q4 to 2011Q4 and the 15% decline in stock market values over the same period (including the 31% decline in stock values from 2006Q4 through 2009Q1 that jarred confidence). As a result, the recovery of consumption from the deep 2008-2009 recession was the slowest on record.
Based on the Case-Shiller-Quigley estimated elasticities, the increase in household net worth since the pandemic, particularly the strong gains in real estate values, has lifted consumption substantially, by approximately 4%-5%. Other research has found that the wealth effect on consumption operates with a lag (Dynan and Maki 2007). The current general health of household balance sheets and low debt service costs suggests the positive wealth effect on consumption may be extended. Certainly, the positive wealth effect would be insufficient to offset an unanticipated large decline in employment or a reversal in the recent decline in inflation and interest rates, but on the margin is clearly benefiting the trend in consumption.
References
Case, Karl, John M. Quigley and Robert J. Shiller (2013), “Wealth Effects Revisited: 1975-2013”, National Bureau of Economic Research, Working Paper 18667.
Dynan, Karen E. and Dean M. Maki (2007), “Does Stock market Wealth Matter for Consumption”, Board of Governors of the Federal Reserve System.
Greenspan, Alan and James Kennedy (2007), Sources and Uses of Equity Extracted from Homes”, Federal Reserve Board of Governors, Discussion Series 2007-20.
Chart 1. Real Disposable Personal Income and Consumption
Chart 2. Household Net Worth and Net Real Estate Value
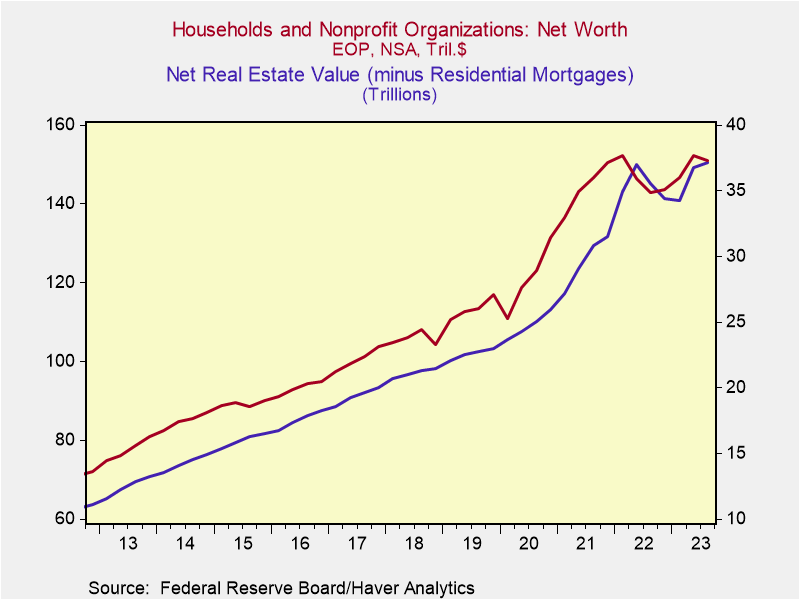
Table 1. Balance Sheet of Households and Nonprofit Organizations
2019Q4 ($T) 2023Q3($T) chg. in $Tril chg. in %
Assets 133.5 176.5 42.8 32.0
Financial 93.6 112.4 18.8 20.1
Equities 43.4 55.4 12.0 27.6
Liquid* 3.5 7.9 4.4 125.7
Nonfinancial 39.9 58.8 15.9 39.8
Res real estate 29.9 45.5 15.6 52.2
Mortgage debt 10.5 12.9 2.4 22.9
Owners equity 19.4 32.6 13.2 68.0
Liabilities 16.6 20.3 3.7 22.3
Household Net Worth 116.9 151.0 34.1 29.1
Source: Federal Reserve Board
Note: *Deposits and money market funds
Chart 3. Household Net Worth Characteristics, 2020-2023
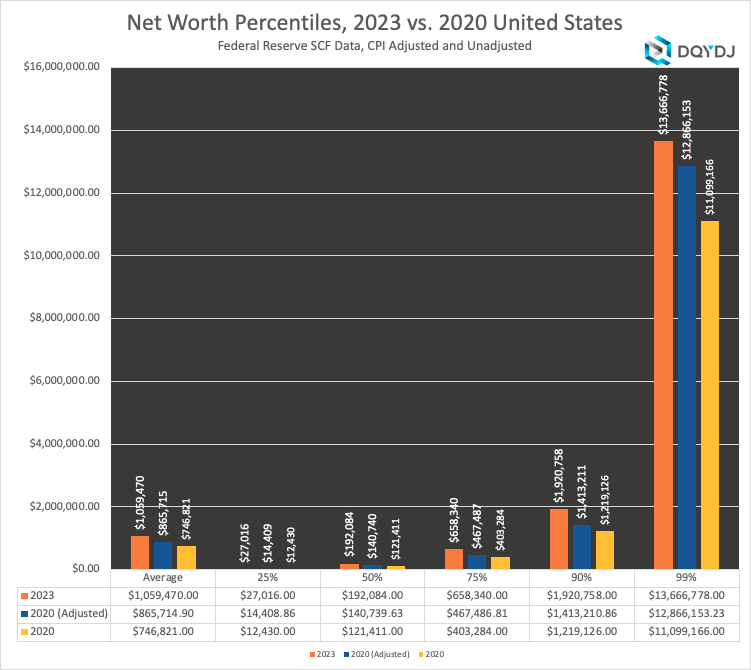
Source: Federal Reserve Board of Governors Survey of Consumer Finances, 2022.
Chart 4. Household Net Worth Percentiles by Age
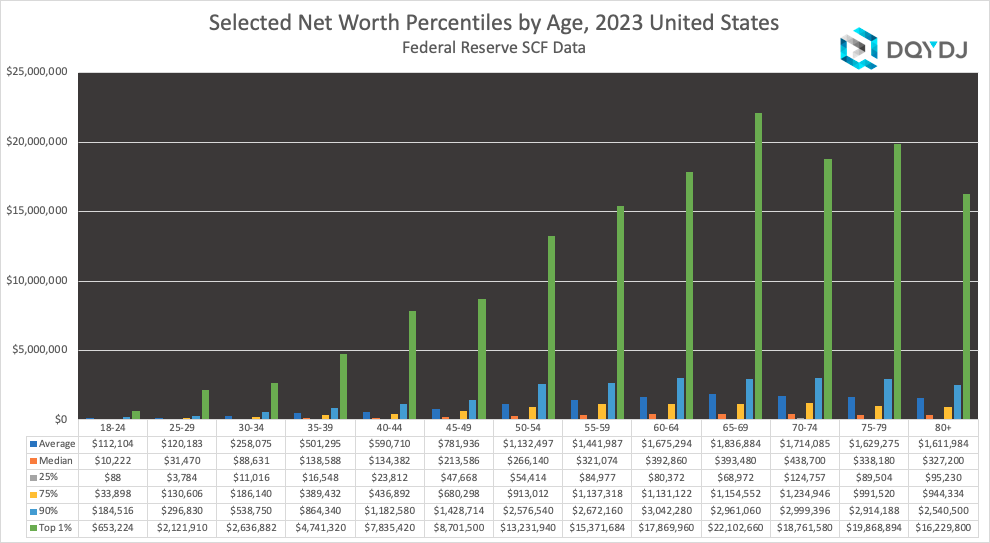
Source: Federal Reserve Board of Governors Survey of Consumer Finances, 2022.

Factors Supporting a Soft Landing
The healthy job gains in the November Employment Report underline the resilient economy and are consistent with sustained expansion. While employment is a coincident indicator, it’s important to understand the key factors that support a soft landing, or at minimum would likely make any economic downturn sufficiently mild that it will not take on the characteristics of a typical recession.
*Consumption growth will slow, but it will be supported by continued increases in real disposable income, declines in real interest rates, and record high household net worth that lifts the propensity to spend. Consumption of services will continue to rise while spending on goods will fall.
*Residential investment, including spending on new construction and home improvements, which typically falls during recession, now looks firm following its decline in 2022, and moderating mortgage rates and ongoing shortages of homes for sale provide a positive outlook for 2024 and beyond.
*Business investment is being boosted by the government’s tax credits and other incentives. In addition, the growing importance of investment spending in software and R&D, which is now over 40% of total business fixed investment (BFI), significantly dampens the cyclicality of business investment, traditionally a major contributor to recessions.
*Government purchases (consumption and investment) have been contributing significantly to GDP growth, with rapid gains in spending on the infrastructure initiatives and higher defense spending. These government programs are generating government jobs and more employment in private construction, defense, and related sectors. Spending on infrastructure, government-subsidized investment, and defense spending will continue to rise rapidly in 2024.
Employment and consumer spending drive each other. Businesses continue to increase employment to meet rising product demand, which increases disposable income, the major source of demand. Unlike prior mature stages of economic expansions when businesses had excess labor relative to output, which made jobs vulnerable, pandemic labor shortages constrained business hiring. As a result, employment is well aligned with output. Some businesses facing weak demand are keeping labor and reducing hours because of the high costs and disruptions of job layoffs and rehiring. Moreover, in general, businesses have efficiently managed inventories and in situations in which undesired inventories have resulted from soft demand, like select retail sectors, high levels of business cash-on-hand provide businesses flexibility to cut product prices and absorb squeezed margins.
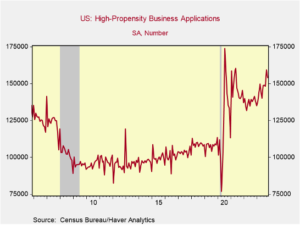
Meanwhile, the heightened business flexibility in using labor inputs and mobility of labor supply is reflected in the strong employment gains in the Household Survey (+747,000 in November and +2.2% yr/yr versus 1.8% in establishment payrolls). Paralleling this, there has been a sharp rise in new business applications (Chart 1). This is contributing to personal income gains. Moreover, the recent surge in new business applications and mobility of labor may be the precursor of sustained gains in productivity.
Chart 1.
The combination of job gains and wage increases — average hourly earnings are up 4% yr/yr — have boosted real (inflation-adjusted) disposable personal income, by far the most important factor driving consumer spending by 3.8% yr/yr. This is materially higher than the average annual increase of 2.4% during the 2010-2019 expansion or the 2.6% annual rise during the 2002-2007 expansion. Gains are expected to moderate. However, there are offsetting factors. As described below, an array of government spending initiatives are increasing government employment and also increasing jobs at private contractors, particularly in health and social services, construction and in defense related activities. In addition, the recent decline in interest rates and funding costs will support debt-financed consumption. Also, increases in household net worth to record-breaking highs increases the propensity to spend disposable income.
The interest sensitive sectors. Two of the most traditionally interest-sensitive sectors of the economy, motor vehicle sales and housing, have fared well in response to the Fed’s 5.5 percentage point increase in interest rates and the higher mortgage rates. Auto sales drifted lower when the Fed was hiking rates aggressively in 2022 but in 2023 have risen and remained above the 15 million annualized pace despite significantly higher borrowing costs. Over 80% of all new motor vehicle sales are financed. The gradual easing of inventories for sale has helped. The recent declines in financing costs and increased production following the UAW strikes will support sales in 2024. Housing activity—sales, construction and home improvements—have been characterized by offsetting factors:
- Favorable: rising employment and disposable income and low unemployment, demographics and new family formation; the heightened mobility of labor; and record-breaking household net worth
- Unfavorable: insufficient inventories of homes for sale, high prices (the Case-Shiller Home Price Index is up 45.5% from pre-pandemic levels), the moderately high mortgage rates, and the lowest affordability index in decades.
The recent decline in mortgage rates will provide some relief to homebuyers. Housing activity will have a strong 2024. While residential investment is only 3.3% of GDP (down from 4.4% in 2021Q1 and 6.8% in 2005Q4), it punches well above its weight in contributing to economic activity and jobs.
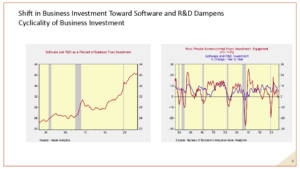
The changing composition of business investment. Business investment in software and R&D have become increasingly important components of BFI and critical to technological innovations and new product development.Investment spending in software and R&D investment is different than traditional business fixed investment in equipment and structures in three ways: 1) it tends to be financed with internal cash flows rather than debt or equity, 2) it is less interest rate sensitive and 3) it is less cyclically sensitive. Strikingly, business spending on software and R&D has risen to over 40% of total BFI and, strikingly, it barely declined during the severe financial crisis and deep recession of 2008-2009 recession and continued to rise rapidly during the 2020 pandemic (Chart 2). Businesses must maintain leading-edge software to remain competitive and R&D has become the mainstay for many growth firms. Thus, business investment can be expected to dampen any contraction.
Chart 2.
At the same time, the generous 25% tax credits and other provisions of the CHIPS Act are stimulating business investment in computer chip, battery and related manufacturing facilities. This is largely offsetting the depressing impact of the adjustments in commercial real estate on business investment in structures.
Fiscal stimulus. Combined, the American Infrastructure and Jobs Act, the CHIPS Act, the subsidies of the so-called Inflation Reduction Act and related green initiatives constitute the largest set of government infrastructure investment initiatives since the 1950s. I described the stimulative impacts of these policies in detail in “Fiscal Policy and The Fed Work at Cross-Purposes,” (Hoover, August 9, 2023). The $1.2 trillion authorized by the American Infrastructure and Jobs Act of 2021 continues to be spent, boosting government purchases counted directly in GDP. Following the surge beginning in mid-2022, growth is continuing at a diminished pace. The infrastructure initiative is creating jobs at private contractors.
The business investment responses to the CHIPS Act are multiples higher than earlier estimates by the Congressional Budget Office and Joint Tax Committee (James Lucier, “Does Bigness Bring Risk for the IRA Credits?, Capital Alpha, December 1, 2023). According to revised estimates by the CBO, JCT and others, these open-ended government subsidies are expected to continue to generate increases in investment throughout the decade.
Legislated increases in spending authorizations for defense and national security is adding directly to government purchases and GDP. Increased spending on weapons in support of Ukraine and Israel are increasing employment at a wide array of U.S. defense contractors and their suppliers.
Risks to the Forecast. Consumer spending may weaken significantly in early 2023 following the holiday season, forcing firms to step up their efforts to cut operating expenses and job layoffs. This would cut into disposable income and consumer confidence. If this happens, the impact should be noticeable in the data but would be limited insofar as businesses have efficiently managed their production processes, and kept labor inputs and inventories under control.
The key risk to the economic expansion would be if monetary policy becomes too restrictive, it would slow aggregate demand too much. So far, the economy has remained resilient and responded well to the Fed’s earlier aggressive interest rate increases. Even though the Fed raised rates aggressively in 2022, the real rate remained negative, suggesting sustained monetary accommodation.
As inflation has receded, the real Fed funds rate has risen well above standard measures of the natural rate of interest (r*) while M2 money supply continues to decline yr/yr, reducing the earlier bulge generated by the excessive monetary and fiscal stimulus of 2020-2021. Accordingly, monetary policy is in the restrictive zone.
The Taylor Rule, based on an assumption of r* = 0.5% and core PCE inflation of 3.7%, estimates that the current 5.5% Fed funds rate is in an appropriate range consistent with the Fed’s longer-run inflation target of 2%. Maintaining the Fed funds rate at 5.5% as inflation recedes further would make monetary policy more restrictive, potentially leading to an undesired slowdown in aggregate demand. Looking forward to mid-2024, if core inflation recedes to 3%, the Taylor Rule would estimate the appropriate Fed funds rate at 4.5%. However, Fed Governor Chris Waller has indicated that it would be appropriate to lower rates in response to further declines in inflation, and presumably other Fed members would agree.
Conclusion
I expect the Fed will respond to these risks appropriately and the positive economic factors will support sustained expansion.