*The yield curve, which has been inverted since June 2022, will revert back to positive in 2024 as financial markets anticipate and respond to the Fed lowering its nominal policy rate to avoid undesired restrictiveness in monetary policy as declines in inflation raise real rates.
*Two normalizations have occurred: the Fed has raised rates well above inflation following a sustained period of a negative real policy rate, and bond yields have risen to appropriately reflect inflationary expectations and sustained economic growth, following a sustained period of historically low yields. The normalization of the yield curve is now unfolding. Most of the trend changes in the yield curve will involve short-term rates coming down.
*As long as the economy continues to expand and avoids a traditional recession with significant declines in real activity, which is the highest probability, the return to a positive yield curve driven by lower nominal costs of short-run funding will be significantly positive for the stock market, particularly interest-sensitive sectors.
*Regression analysis is used to estimate a high positive correlation between the stock market and the Treasury yield curve and in particular finds a very significant response of the S&P Financial Stock Index to a steepening yield curve. This confirms expectations and suggests that stock market responses to the unfolding normalization of the yield curve will highlight 2024.
The lengthy yield curve inversion
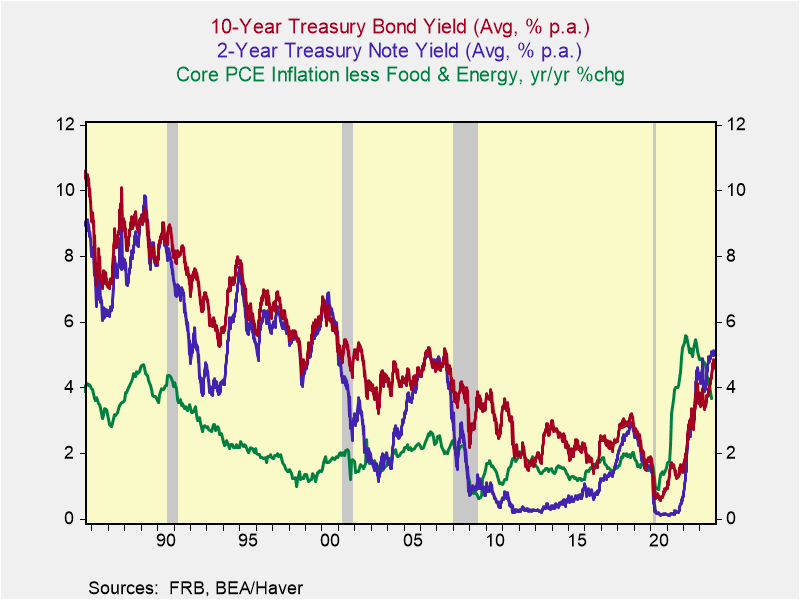
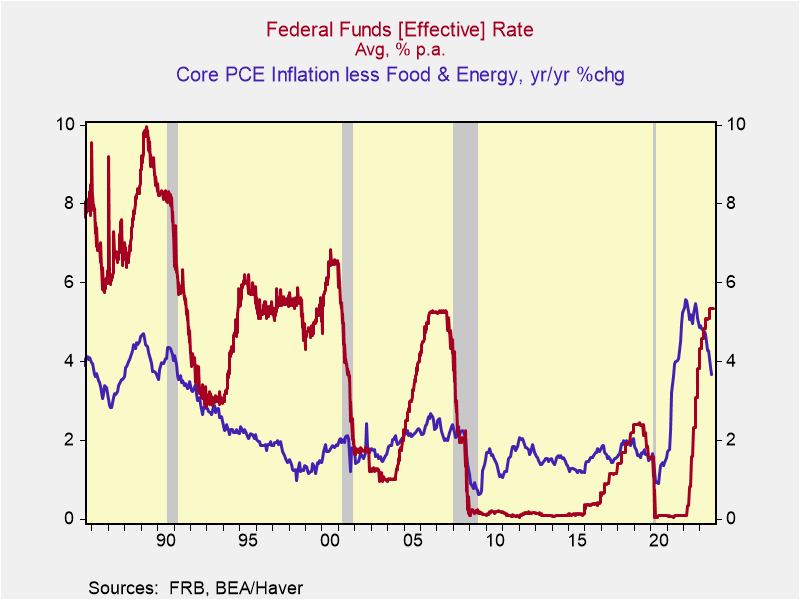
The yield curve inverted in mid-2022 as short-term rates rose dramatically faster than bond yields when the Fed shifted toward aggressive rate hikes in lagged response to the persistently high inflation. Bond yields were rising but remained below inflation, reflecting only modest increases in inflationary expectations (Chart 1), while the Fed funds rate was far below inflation (Chart 2). Forecasters who mechanically jumped on the recession bandwagon based on the history that curve inversions preceded recessions missed the critical observation that monetary policy remained easy based on the deeply negative real Fed funds rate and earlier surge in M2 money supply, accompanied by a heavy dose of fiscal stimulus.
It wasn’t until Spring 2023, when the Fed raised its target rate to 5% that the Fed funds rate moved above core PCE inflation. From April through September, yields rose sharply, adjusting to the Fed’s moderating rate increases and “higher-for-longer” forward guidance. During this period, core PCE inflation receded from 4.75% to 3.75%, resulting in significantly positive inflation adjusted yields on 2-yr Treasury notes and 10-yr Treasury bonds.
Since mid-October, Treasury yields have receded significantly, from 5.1% to 4.8% on 2-yr notes and from 5% to 4.4% on 10-yr bonds, as signs of economic slowdown and improving inflation data have guided markets to shift expectations the Fed’s next move will be to ease rather than raise rates further.
Chart 1. Interest Rate Yields and Inflation

Chart 2. The Federal Funds Rate and Inflation

Anticipating a positive yield curve
10-yr Treasury bond yields of approximately 4.5% are much better aligned to the inflation and economic fundamentals than any time since the onset of the pandemic and are not expected to change dramatically, while short-term rates are expected to fall as markets anticipate the Fed will adjust down its target rate.
10-yr Treasury bonds have adjusted significantly since 2020-2021, when yields remained below inflation and inflationary expectations (in 2020, yields averaged less than 1% and less than 2% in 2021, even as inflation soared). Current yields provide roughly 2% ex ante real yields above inflationary expectations of approximately 2.5%, within their historic range during periods of economic growth along its potential path. Real bond yields may fall modestly further if more weak economic data raise concerns about the sustainability of the economic expansion.
Short-term rates, including 2-yr Treasury yields, will move in anticipation of the Fed changing its policy rate. The Fed’s current Fed funds rate target is 5.25%-5.5%, and the effective funds rate is 5.33%. Current 2-yr yields of 4.8% reflect market expectations of the Fed funds rate and short-term borrowing costs over the next two years.
Three key observations about the Fed
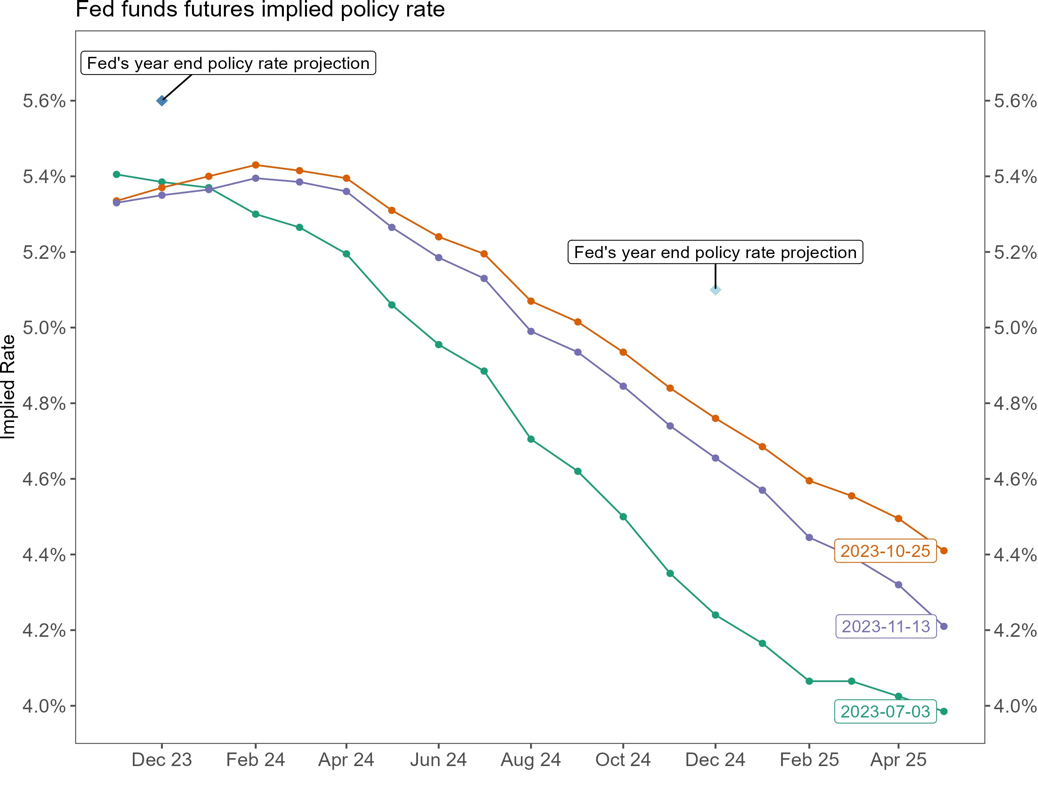
First, in its latest Summary of Economic Projections, the FOMC members estimated the most appropriate Fed funds rate to be 5.6% at year-end 2023 (involving another 25-basis point hike), 5.1% at year-end 2024, 3.9% at year-end 2025 and 2.5% in the longer run. Combined with its projections of declining inflation—the core PCE inflation is estimated to be 3.7% Q4/Q4 in 2023, 2.6% in 2024, 2.3% in 2025 and 2% in the longer-run—the Fed is signaling that a persistently high real policy rate will be maintained until inflation falls to 2%. If the Fed’s policies stick with its September projections, the outlook for the yield curve is murky, depending on how the economy and inflation respond to monetary policy.
The Fed’s projections, which are conditional on its members’ economic and inflation projections, are far above the Fed funds futures implied policy rates, as shown in Chart 3. Recent history indicates that the Fed’s forecasting track record is poor and its forward guidance is unreliable (Levy, “The Fed: Bad Forecasts and Misguided Monetary Policy”, Hoover Monetary Policy Conference, May 2023). Meanwhile, the Fed funds futures market tends to be volatile, fluctuating with economic and inflation data and changes in the Fed’s forward guidance.
Based on the assumption that inflation settles around 2.5% and the natural rate of interest r* is between recent estimates of 0.5% and 1%, the Fed funds rate would eventually reach 3%-3.5%. This would be consistent with a decline in 2-yr Treasury yields and a comfortably positive yield curve. Unanticipated economic weakness would likely generate a quicker path toward lower rates, while sustained healthy growth would likely be associated by a slower path.
Chart 3. Fed Funds Futures Implied Policy Rate

Second, key indicators suggest that monetary policy is restrictive—the Fed funds rate of 5.5% is 1.75 percentage points higher than the 3.75% yr/yr core PCE, putting it well above standard estimates of the natural rate of interest r*, and M2 money supply continues to fall (3.7% yr/yr) following its surge in 2020-2021 associated with the confluence of excessive monetary and fiscal stimulus. (Based on the 3.75% core inflation and an estimated r* of 0.5%-1%, the Fed funds rate is roughly in line with Taylor Rule estimates of monetary policy that would be consistent with a goal of 2% inflation.) As inflation drifts down, the Fed will need to lower its nominal rate target further to avoid becoming too restrictive.
Third, despite the Fed’s aggressive monetary tightening following its monumental inflationary policy blunder, its operational strategic plan adopted in August 2020 continues to prioritize its employment objective in its dual mandate. With inflation “heading in the right direction”, as several Fed members have already noted, it’s only a matter of time before the Fed acknowledges that it will not persist in maintaining the current level of interest rates to push inflation to 2% if the costs of doing so are significant short-term economic weakness and higher unemployment. The Fed has a long history of prioritizing low unemployment over inflation, and this time is unlikely to be any different.
Within the Fed, Fed Chair Powell has led the hawks—Governors Waller and Bowman and Mester, Cleveland Federal Reserve Bank President—in advocating higher rates, while the doves, led by FRB of Chicago President Goolsbee, to date have been quieted by the economic resilience. Mounting sighs of economic slowdown and labor market weakness will shift the Fed’s balance. Chair Powell is very well-intentioned and does not want to generate a recession. All recently new Fed members (Governors nominated by President Biden and Federal Reserve Bank Presidents whose appointments have been heavily influenced by the Board of Governors), have a dovish tilt and will exert pressure to lower rates.
(Notes on the real economy: its resilience stemmed from several factors, including the extended period of strong job gains as businesses caught up with the employment gaps generated by labor supply shortages, which boosted real disposable income, the key driver of consumption; ongoing fiscal stimulus, as I have emphasized in prior research (Fiscal Policy and the Fed work at Cross Purposes, August 2023); and the observation that even though the Fed began raising rates in Spring 2022, as measured by the negative real Fed funds rate, monetary policy didn’t turn restrictive until Spring 2023.
By far the highest probability is either a soft-landing or very mild recession, while the probability of a traditional recession is very low. While consumption growth is expected to slow sharply, housing (residential investment) is expected to remain firm, business investment is far less cyclical than historically, as investment in software and R&D which is quite resilient to recession is now over 40% of total business fixed investment, and government purchases will continue to grow, driven by domestic infrastructure and industrial policy policies already enacted, and higher demand for defense and national security. Slower gains in employment will contribute to moderating growth of disposable income and real purchasing power. With job quit rates down, reflecting rising uncertainties, businesses may need to increase layoffs.
Notes on inflation and aggregate demand: while headline inflation has fallen significantly, and PCE Price Index of goods are falling, core inflation remains sticky and far above the Fed’s 2% target, driven primarily by services inflation, which remains 5.5%; and nominal GDP, the broadest measure of aggregate demand, continues to grow too rapidly (6.7% yr/yr) and must slow to roughly 4% to be consistent with 2% inflation. Nominal GDP growth is projected to subside significantly from its unsustainable Q3 pace, helping to ease price increase pressures, while increases in shelter costs, the biggest component of services inflation, will continue to recede in lagged response to home prices.) Nevertheless, it is unlikely that core inflation will fall to 2%, and it is even less likely the Fed will continue to aggressively pursue 2% inflation as the short-run economic costs of doing so mount.
Stock market responses
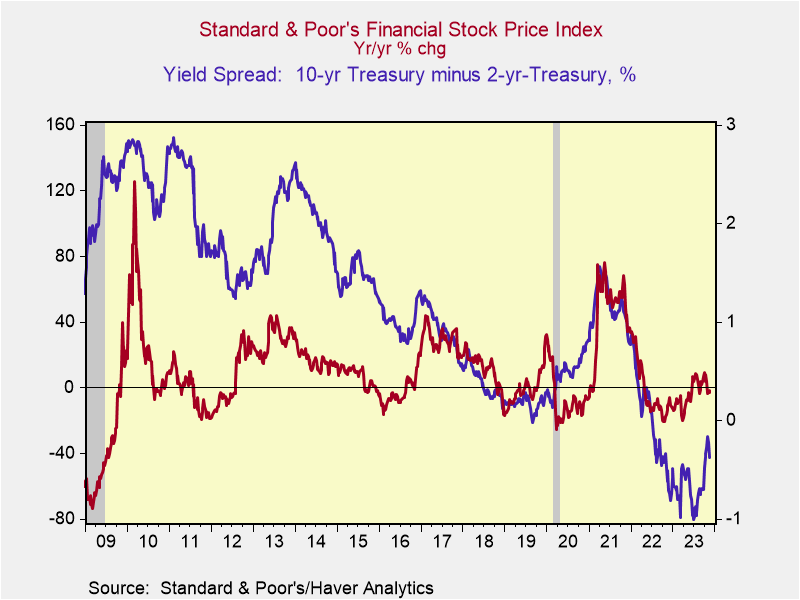
The stock market has responded positively to the recent fall in interest rates and a lessening of the yield curve inversion reflecting softening growth and lower inflation that has induced a shift toward expecting that the Fed’s next move will be to lower rates. Casual observation based on history suggests that the reversion to a positive yield curve in 2024 will continue to boost the stock market (Chart 4). This seemingly will be particularly favorable to financial companies, as long as the economy does not go into recession.
Chart 4. S&P500 Financial Stock Index

To confirm this expectation, two simple regression equations are estimated:
- S&P500 FI = f (C, YC, RD) in which:
S&P500FI is the S&P500 Financial Stock Index, measured as a yr/yr % change
YC = 10-yr Treasury yield minus 2-yr Treasury, measured in percentage points
RD = Dummy variable for recession in which RD = 0 during economic expansion and RD = 1 during recession
C = constant
- S&P500 = f (C, YC, RD) in which:
S&P500 is the S&P500 Stock Index, measured as a yr/yr % change
The empirical results, using monthly data estimated across two sample periods (2000 to the present, and 2010 to the present) shown in Tables 1 and 2, reveal the statistically significant and large positive correlation between the S&P500 Financial Stock Index and the yield spread, and the S&P 500 and the yield spread. The YC is statistically significant at the 5% significance
Table 1. Regressions of S&P500FI = C + YC + RD
| Monthly Data from 2000-Present | Monthly Data from 2010-Present | ||||
| Intercept | 5.92 ** | 2.05 | |||
| (1.83) | (2.33) | ||||
| 10yr-2yr Treasury Spread | 2.84 * | 8.52 *** | |||
| (1.23) | (1.59) | ||||
| Recession Dummy | -40.68 *** | -22.94 | |||
| (3.98) | (13.66) | ||||
| N | 286 | 166 | |||
| R2 | 0.27 | 0.17 | |||
| *** p < 0.001; ** p < 0.01; * p < 0.05. | |||||
| Table 2. Regressions of S&P500 = C + YC + RD | |||||
| Monthly Data from 2000-Present | Monthly Data from 2010-Present | ||||
| Intercept | 7.48 *** | 5.39 *** | |||
| (1.25) | (1.32) | ||||
| 10yr-2yr Treasury Spread | 1.65 | 6.06 *** | |||
| (0.84) | (0.90) | ||||
| Recession Dummy | -31.29 *** | -13.14 | |||
| (2.72) | (7.71) | ||||
| N | 286 | 166 | |||
| R2 | 0.32 | 0.24 | |||
| *** p < 0.001; ** p < 0.01; * p < 0.05. | |||||
level in the equations estimated over the period 2000 to present, and at the 0.1% significance level in the equation estimated over the period 2010 to the present.
Equations 1 estimates the elasticity of the S&P500 Financial Stock Index to changes in the independent variables. Across both sample periods, a 1 percentage point increase in the yield spread is estimated to increase the yr/yr percentage change in the S&P500 Financial Index, by 8.5% in the 2010-present estimation period and 2.8% in the 2000-present estimation period. The 8.5% estimated elasticity in the 2010-present period suggests that controlling for the other independent variables, a 1 percentage point yield curve steepener would be associated with an 8.5% rise in the S&P500 Financial Stock Index.
The significant magnitude of the estimated dummy variable indicates the potentially large negative effect of recession on the stock market. Undoubtedly the estimated magnitude of the recession dummy variable reflects the dramatic declines in the financial sector stocks during the 2008-2009 financial crisis. Presumably, these estimates would overstate the impacts on financial stocks if a mild recession similar with the 2001 recession were to occur.
Equation 2 replaces the S&P500 Financial Stock Index with the S&P500 as the dependent variable. The elasticity of the S&P500 with respect to changes in the yield curve is positive and statistically significant, but at 6.1, it is somewhat smaller than the estimated elasticity of the S&P500 Financial Index.
These empirical findings highlight the important impacts of the Fed’s monetary policy on key financial market outcomes.